
 English
 German
  Italian
  Hi, User
 Fibonacci Trading in Context
The beauty of Fibonacci in trading lies in its simple yet powerful ability to map out market movements.
While traders worldwide use these special ratios to spot potential market turning points, there’s a big difference between simply placing Fibonacci tools on your chart and using them effectively.
Through my years in the markets, I’ve seen how these tools can either guide you to consistent profits or lead to repeated losses – it all comes down to one key factor.
This is where Fibonacci trading in context makes all the difference. It’s not just about drawing lines and waiting for price to hit certain levels.
Instead, it’s about understanding how Fibonacci fits into the bigger market picture.
Let me show you how this practical approach can sharpen your market analysis and potentially give you that extra edge you’ve been looking for.
FIBONACCI TRADING IN CONTEXT


Fibonacci trading in context goes beyond simply identifying potential reversal levels on your charts.
It’s the art of combining Fibonacci tools with established support and resistance zones while considering the broader market trend.
This integrated approach helps confirm true market opportunities rather than relying on Fibonacci levels alone, leading to more reliable trading decisions.
HOW TO USE FIBONACCI IN FOREX COMPREHENSIVE GUIDE

Let’s put theory into practice using GBPJPY as our example. Before we dive in, remember these essential principles:
Key Requirements:
• Only trade Fibonacci in trending markets
• Fibonacci levels must align with previous support/resistance zones
• Look for clear ABCD pattern formation

• Pattern should fit the overall market direction
Understanding the Two Core Fibonacci Concepts:
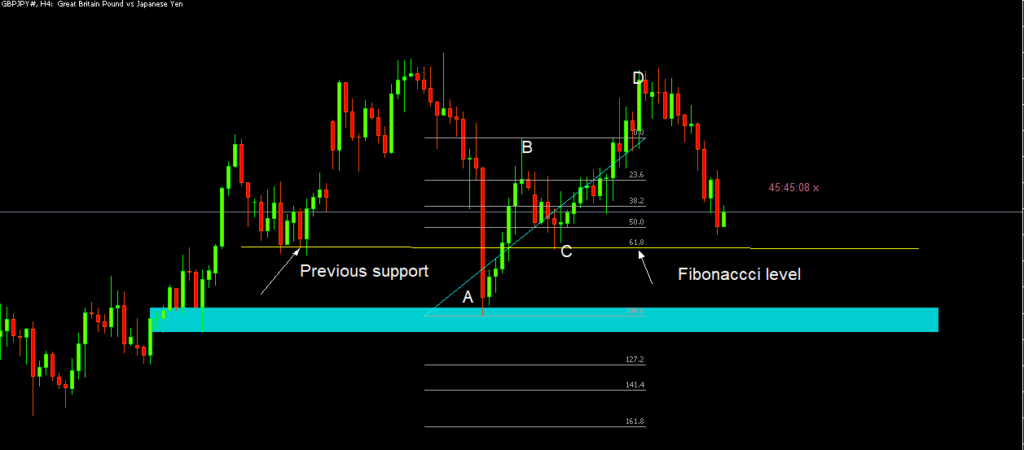
1. Fibonacci Retracement
Helps identify potential support/resistance levels after a strong market move.
Point A: Starting point of market move
Point B: Peak/bottom where price exhausts
Point C: Retracement level (aligns with previous S/R)
Point D: Pattern completion point
To find retracement levels, draw from A to B.
Key levels:
• 38.2%
• 50%
• 61.8%
2. Fibonacci Extension
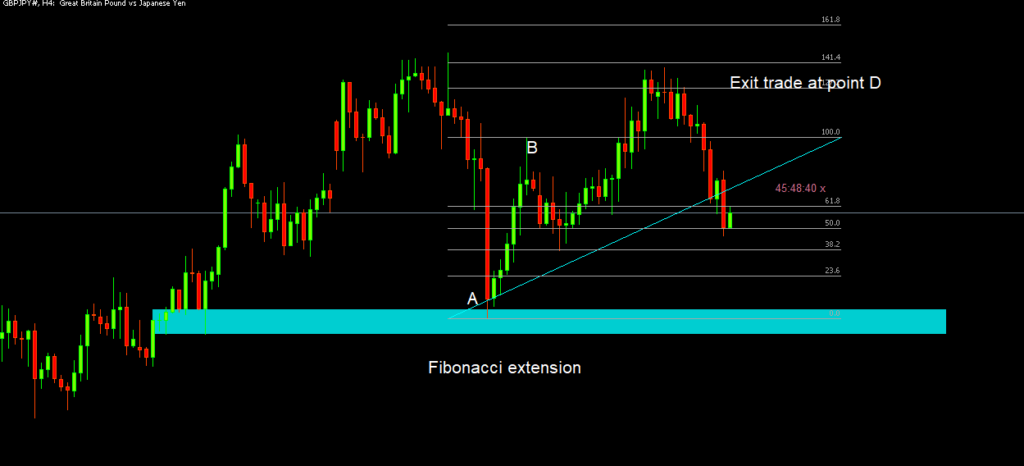
Used for profit targets at point D (potential reversal zone).
Draw from B back to A to find:
• 127.2% (recommended profit target)
• 141.4%
• 161.8%
Trading Tip: Conservative traders should target the first extension level (127.2%). Alternatively, use the next visible market high/low as your target.
FIBONACCI CONFLUENCE STRATEGY
Think of Fibonacci confluence as finding those “sweet spots” in the market where multiple signs point to the same area.
It’s like when several of your friends independently recommend the same restaurant – that’s probably a good place to eat, right?
Similarly, when different Fibonacci levels cluster together with support and resistance, they create powerful trading zones.
Here’s what makes this strategy special: It combines the age-old wisdom of Fibonacci numbers (those magical mathematical sequences found in nature) with real market behavior.
When you’re looking at your forex charts, you’re not just plotting random lines you’re identifying areas where traders historically struggled to push prices higher (resistance) or lower (support).
Let’s break it down into something more practical. Imagine you’re looking at a EUR/USD chart. You notice a strong upward move from 1.0800 to 1.1000.
You draw your Fibonacci retracement levels from this move. Then, you spot that the 61.8% Fibonacci retracement level sits right around 1.0876, which – here’s the interesting part – also happens to be where the price bounced several times in the past month. That’s confluence!
What makes this approach so powerful for forex trading is that you’re not just relying on one signal. You’re waiting for multiple technical factors to line up, which typically means:
Higher probability trades
Clearer entry and exit points
Better risk management opportunities
Stronger validation of potential reversal zones (for fib extension)
This strategy puts you in sync with how the forex market naturally moves. Currency pairs often respect these mathematical relationships because many traders worldwide use similar tools and analysis methods.
When you trade with Fibonacci confluence, you’re essentially trading with the crowd’s psychology while having a mathematical edge.
A practical tip: Don’t just look for two levels matching up – the more confluence factors you find, the stronger the signal. Maybe you see the 61.8% Fibonacci retracement matching with:
A previous support level
A daily pivot point
Another Fibonacci level from a different swing move
That’s when you’ve found trading gold! You’re now looking at the market in the right context, understanding that prices don’t move randomly but often bounce off these mathematically significant levels.
Remember though, like any strategy, it’s not about finding the Holy Grail. It’s about having a systematic approach that puts probability in your favor.
When you use Fibonacci confluence in forex trading, you’re working with a method that combines mathematical precision with market psychology – and that’s a powerful combination.
The beauty of this strategy is that it helps you make sense of the seemingly chaotic forex market movements.
You’re not just throwing darts in the dark; you’re trading with a plan, looking for those special areas where multiple factors suggest a potential reversal or continuation.
Post a Reply
You must be logged in to post a comment.