
 English
 German
  Italian
  Hi, User
 Boom 300 Index: The Ultimate Trading Guide for Synthetic Indices Enthusiasts
The Boom 300 index stands as one of Deriv’s most popular synthetic trading instruments, offering traders 24/7 market access without the constraints of traditional market hours or external economic factors.
Unlike conventional currency pairs or stock indices, this synthetic instrument operates on a predictable volatility model where significant price spikes occur approximately once every 300 ticks.
This unique characteristic creates consistent trading opportunities that appeal to both experienced Forex traders seeking diversification and newcomers exploring synthetic indices.
For those unfamiliar with synthetic indices, these instruments simulate market movements in controlled environments, free from real-world market disruptions.
Understanding the Boom 300 requires mastering its specific behaviour patterns, trading mechanics, and the sophisticated analytical tools available through Deriv’s integrated platform ecosystem.
This comprehensive guide covers everything from basic specifications to advanced trading strategies.
WHAT EXACTLY IS THE BOOM 300 INDEX?


The Boom 300 index is Deriv’s synthetic instrument that simulates market movements with built-in spike patterns.
Unlike traditional currency pairs or stock indices, this synthetic creation operates on a predictable volatility model where significant price spikes occur roughly once every 300 ticks.
Think of it as a controlled rollercoaster designed for traders. The index maintains steady movement punctuated by dramatic upward spikes that create profit opportunities for those positioned correctly.
This predictability sets it apart from chaotic real-world markets influenced by economic news or political events.

The beauty lies in its consistency. While you can’t predict exactly when the next spike will occur, you know it’s coming within a reasonable timeframe.
This characteristic makes it particularly appealing for traders who prefer structured volatility over unpredictable market chaos.
KEY SPECIFICATIONS YOU NEED TO KNOW
Understanding the technical specifications is crucial for effective trading:
Contract Details:
- Contract size: 1 unit
- Base currency: USD
- Minimum volume: 1 lot
- Volume limit: 300 lots
- Minimum spread: 0.709 pips
- Effective leverage: 1:100
- Trading hours: Sunday 00:00 – Saturday 24:00 GMT
Given the minimum volume requirement, traders should consider maintaining at least $250 in their account for safe trading.
However, smaller accounts can participate by carefully managing position sizes and implementing proper risk management techniques.

The 24/7 trading availability means you’re never constrained by traditional market hours. Whether it’s Christmas morning or a quiet Tuesday afternoon, the Boom 300 index keeps moving, offering consistent opportunities.
BOOM 300 INDEX ON TRADINGVIEW: YOUR TRADING COMMAND CENTRE
The integration between Deriv and TradingView creates a powerful trading environment specifically designed for synthetic indices.
This isn’t your standard TradingView experience it’s been tailored within Deriv’s trading ecosystem to provide seamless functionality.
Advanced Features: TradingView offers over 100 technical indicators, from basic moving averages to complex volatility studies.
You can track live prices, monitor multiple timeframes simultaneously, and execute trades directly from charts.
The platform supports 17 different chart types, allowing you to visualise market data from candlesticks to Renko charts.
Real-Time Synchronisation: Your Deriv X account integrates seamlessly with TradingView.
Your account balance, open positions, and pending orders appear directly on the platform, eliminating the need to switch between multiple applications.
How to Access TradingView for Boom 300 Trading
Getting started involves a straightforward four-step process:
- Open a Deriv Account: Register for a free account or log into your existing one
- Create Your Deriv X Account: Navigate to Trader’s Hub and open a Deriv X account
- Load TradingView Charts: Access the Tools menu and click TradingView to load charts
- Begin Trading: Select Boom 300 index and start implementing your strategies.
IS BOOM 300 INDEX GOOD FOR TRADING?
The Boom 300 index offers distinct advantages for many traders:
Predictable Volatility Pattern: Unlike traditional markets where volatility can be erratic, the Boom 300 index provides structured volatility with spikes occurring approximately every 300 ticks.
24/7 Market Access: Round-the-clock availability eliminates missed opportunities due to market closures, accommodating any trading schedule.
Reduced External Influence: The index operates independently of economic news, political tensions, or unexpected market events, providing a more controlled trading environment.
Leverage Opportunities: With 1:100 leverage available, traders can maximise capital efficiency while maintaining reasonable risk levels.
However, success requires understanding the index’s behaviour patterns and developing strategies specifically tailored to its characteristics.
VOLATILITY COMPARISON: BOOM 300 VS TRADITIONAL CURRENCY TRADING
Is Boom 300 index more volatile than traditional currency trading? The answer reveals fascinating differences that impact trading strategies significantly.
Traditional Forex Volatility: Major currency pairs like EUR/USD typically experience 50-100 pip daily ranges, responding unpredictably to economic indicators and geopolitical events. A single news announcement can move EUR/USD 200+ pips instantly.
Boom 300 Index Volatility: The synthetic nature creates controlled volatility with regular spike patterns. While individual spikes can be substantial, their occurrence follows a predictable framework, allowing traders to develop strategies around expected volatility rather than reacting to market shocks.
This regularity allows focus on technical analysis without constantly monitoring economic calendars or news feeds.
EFFECTIVE TRADING STRATEGIES FOR BOOM 300 INDEX
Successful trading requires strategies specifically designed for the index’s unique characteristics:
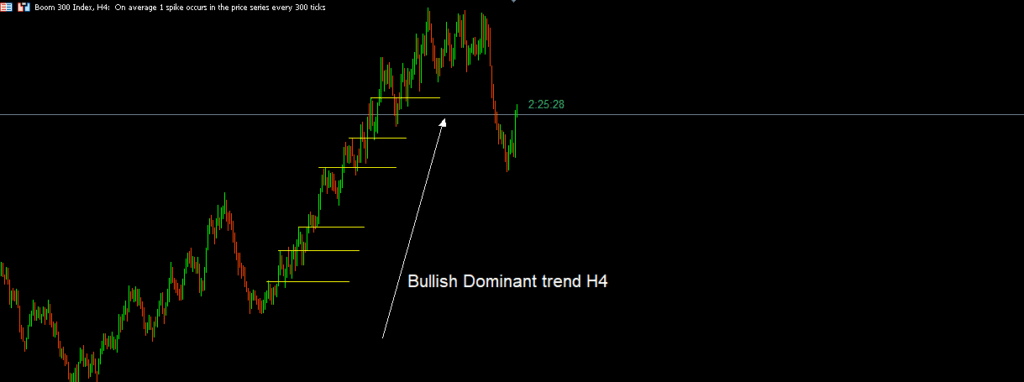
Top-Down Analysis Approach: Start analysis on higher timeframes (H4 or Daily) to identify the dominant trend direction. Look for clear swing highs and swing lows that define overall market structure.

Swing High and Low Strategy: The Boom 300 index respects technical levels remarkably well. Identify key swing points and use these as reference levels for entry and exit decisions.
When the index approaches a previous swing high during an uptrend, consider long positions anticipating the next spike.
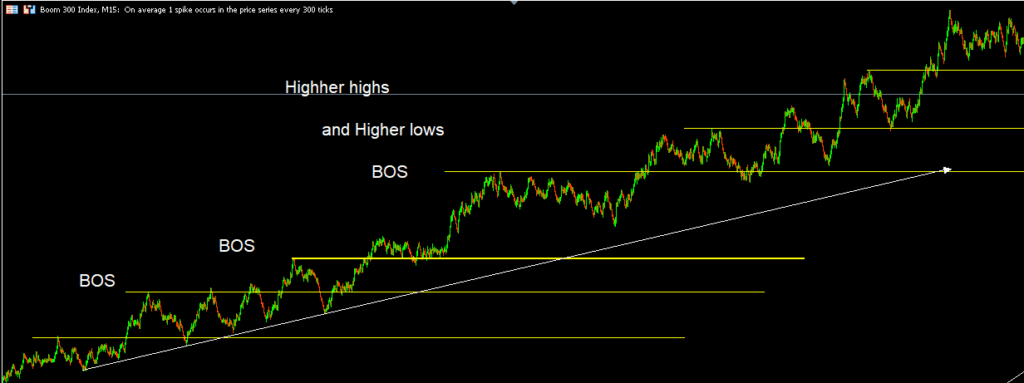
Multiple Timeframe Confirmation: After identifying trends on higher timeframes, drill down to shorter periods (M15 or M30) for precise entry timing.
Look for confluence between your higher timeframe bias and lower timeframe signals.
Spike Anticipation Technique: Since spikes occur approximately every 300 ticks, experienced traders often count ticks from the previous spike to estimate timing.
While not foolproof, this technique helps with position timing and risk management.
ADVANCED FEATURES AND BENEFITS
The Boom 300 index offers several advanced features:
Simulated Market Environment: Operating in a controlled environment means freedom from real-world risks like liquidity gaps, slippage during news events, or unexpected market closures.
Weekend Trading Opportunities: While traditional markets close over weekends, the Boom 300 index continues operating, appealing to part-time traders or those seeking additional opportunities.
Consistent Spread Conditions: The target spread remains stable compared to traditional markets where spreads can widen dramatically during volatile periods.
ACCESSING CURRENT PRICES AND CHARTS
To monitor Boom 300 index prices effectively, access MetaTrader 5 through Deriv’s official website. This platform provides real-time pricing data, comprehensive charting tools, and direct trading capabilities.
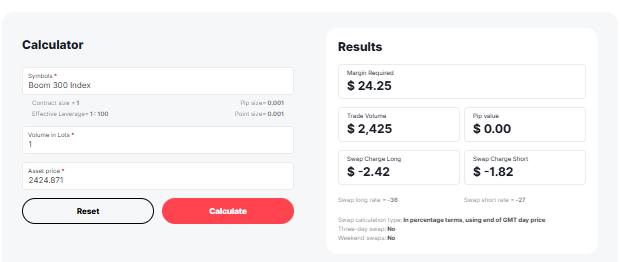
For additional analytical tools, Deriv’s website features a Boom and Crash trading calculator that helps determine position sizes, margin requirements, and potential profit/loss scenarios before entering trades.
RISK MANAGEMENT AND ACCOUNT SIZING
Proper risk management becomes critical when trading synthetic indices:
Minimum Account Considerations: While you can start with smaller amounts, maintaining at least $250 provides adequate buffer for minimum volume requirements and potential drawdowns.
Position Sizing Strategy: Calculate position size based on account balance and risk tolerance. If risking 2% per trade on a $500 account, maximum risk should be $10. Factor in potential spike magnitude when determining appropriate sizes.
Stop Loss Placement: Given the spike-based nature, place stop losses at logical technical levels rather than arbitrary amounts, ensuring they align with overall risk management rules.
UNDERSTANDING THE BROADER SYNTHETIC INDICES LANDSCAPE
The Boom 300 index exists within Deriv’s comprehensive synthetic indices ecosystem.
For traders new to this concept, having an understanding of the synthetic indices market provides valuable context for understanding how these instruments function differently from traditional markets.
Within the synthetic indices family, the Crash 600 index operates on opposite principles, with regular downward spikes occurring approximately every 600 ticks.
Many traders use both indices as complementary instruments, switching based on market conditions and opportunities.
CONCLUSION
The Boom 300 index represents a unique opportunity in today’s trading landscape.
Its predictable volatility patterns, 24/7 availability, and integration with advanced platforms like TradingView create an appealing proposition for traders seeking structured market exposure.
Success requires understanding its distinctive characteristics and developing strategies specifically tailored to its behaviour.
The combination of technical analysis, proper risk management, and patience can lead to consistent trading opportunities in this synthetic environment.
Whether you’re diversifying from traditional Forex trading or exploring synthetic indices for the first time, the Boom 300 index offers a controlled yet dynamic trading experience.
The key lies in respecting its unique nature while applying sound trading principles.
Ready to explore the Boom 300 index? Start by opening your Deriv account, familiarise yourself with the platform’s tools, and begin with conservative position sizes as you develop understanding of this fascinating synthetic instrument.
The 24/7 markets are waiting, and your next trading opportunity might be just 300 ticks away.
Remember: Trading involves significant risk. Never invest more than you can afford to lose and always implement proper risk management strategies.
Post a Reply
You must be logged in to post a comment.