
 English
 German
  Italian
  Hi, User
 Boom 1000 Index Brokers: Your Complete Trading Guide
The synthetic indices market has exploded in popularity, and for good reason.
With markets that never sleep and volatility patterns that can make your head spin, traders are constantly seeking the perfect entry point.
If you’ve been eyeing the Boom 1000 index brokers landscape, you’re not alone. This synthetic beast offers opportunities that traditional forex pairs simply can’t match.
The catch? Not every broker gives you access to this golden goose. Some platforms promise the world but deliver disappointment when you’re ready to execute that perfect trade setup.
So, which brokers actually walk the walk when it comes to Boom 1000 access?
YOUR BOOM 1000 TRADING GATEWAY

When it comes to Boom 1000 index brokers, Deriv stands as the primary gateway for this synthetic marvel.

Through their ecosystem, you can access Boom 1000 via multiple platforms including MT5, cTrader, and their innovative TradingView integration.
Other brokers may offer similar synthetic indices, but Deriv’s Boom 1000 remains the gold standard. The platform provides seamless execution, competitive spreads, and the reliability that serious traders demand.
Whether you’re a scalper hunting quick pips or a swing trader riding longer trends, Deriv’s infrastructure supports your Boom 1000 ambitions with multiple account types and flexible leverage options.
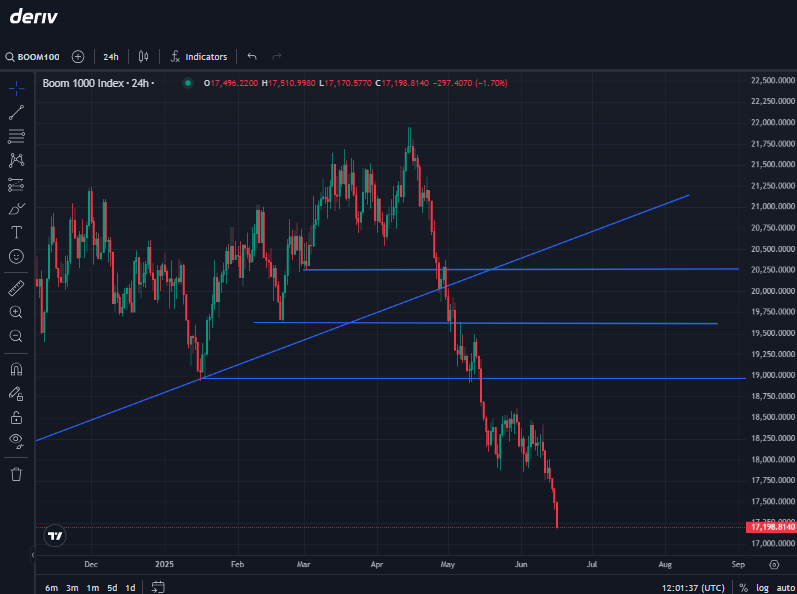
UNDERSTANDING BOOM 1000 INDEX TREND ANALYSIS

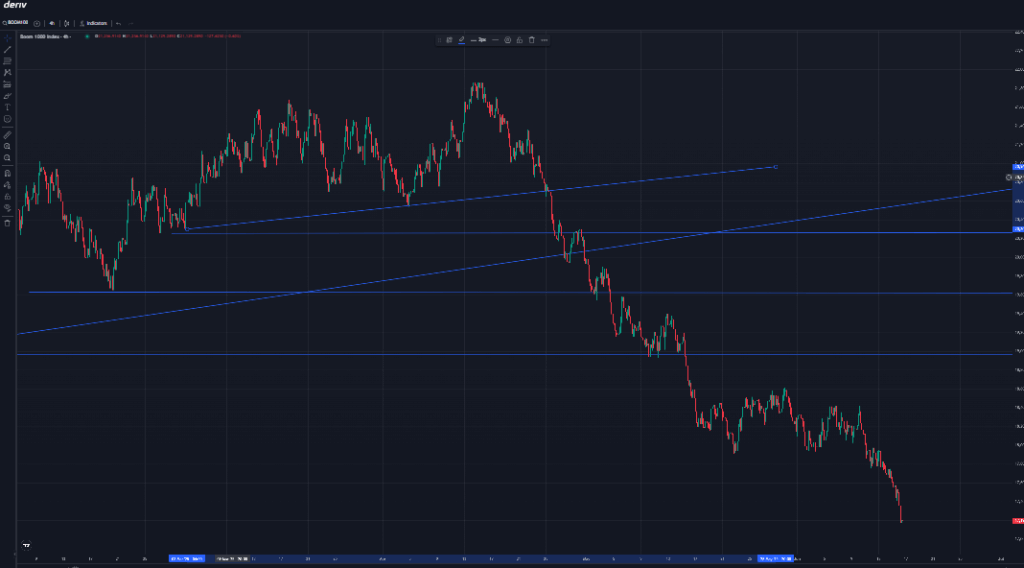
Trading success on Boom 1000 hinges on your ability to read the market’s mood. Here’s where trend analysis becomes your secret weapon.
The golden rule? Always identify the dominant trend on a higher timeframe before making trade decisions on lower timeframes.
Start with the daily chart to spot the overall market direction. Is Boom 1000 climbing steadily, or is it caught in a sideways grind?
Once you’ve nailed down this macro view, drop to the 4-hour chart for your intermediate outlook. This two-step approach prevents you from fighting the market’s natural flow.
The beauty of Boom 1000 lies in its synthetic nature it follows mathematical algorithms rather than economic fundamentals.

This means technical analysis reigns supreme. When the daily trend points upward, focus on buying opportunities during pullbacks on the 1-hour or 15-minute charts.
Conversely, if the higher timeframe shows bearish momentum, hunt for selling opportunities when price rallies into resistance zones.
Pro tip: Use moving averages to confirm trend direction. The 50 and 200 EMAs on the daily chart provide excellent reference points for trend identification.
BOOM 1000 INDEX SUPPORT AND RESISTANCE LEVELS
Support and resistance levels remain the backbone of successful Boom 1000 trading. However, here’s where many traders go wrong they mark every minor level they spot on the chart. This creates visual chaos and analysis paralysis.
Instead, focus on major support and resistance zones on higher timeframes that align with the dominant trend.
These levels carry more weight because they represent areas where institutional-sized orders typically cluster.
Here’s your game plan:
- Weekly levels: Mark significant highs and lows from the past 3-6 months
- Daily levels: Identify key swing points from recent price action
- 4-hour levels: Use these for fine-tuning your entries
The magic happens when these levels converge. A daily resistance level that coincides with a weekly high creates a formidable barrier.
Similarly, when daily support aligns with a major weekly low, you’ve found a high-probability reversal zone.
Remember, Boom 1000’s synthetic nature means these levels often hold with mathematical precision. Unlike forex pairs influenced by news events, Boom 1000 respects technical levels religiously.
CAN I TRADE BOOM 1000 WITH $10?
The short answer? Yes, you can trade Boom 1000 with $10. But here’s the reality check you probably shouldn’t.
Trading with such a small account severely limits your strategic options. Proper risk management becomes nearly impossible when you’re risking 10-20% of your account per trade just to make meaningful profits.
Your trading strategy can’t breathe, and you’ll find yourself taking unnecessary risks to generate decent returns.
Consider this scenario: With $10 and a 2% risk per trade, you’re working with $0.20 risk per position. That’s barely enough to cover a single tick movement on most Boom 1000 setups. You’ll either:
- Take positions too large for your account (recipe for disaster)
- Take positions so small they’re meaningless (recipe for frustration)
Recommended minimum: Start with at least $100-250 for Boom 1000 trading. This gives your strategy room to work while maintaining proper risk management protocols.
BOOM 1000 INDEX CHART ACCESS
Accessing Boom 1000 index charts is simpler than you might think. Deriv has created multiple pathways to ensure traders can analyze and execute trades seamlessly:
MT5 Platform: The MetaTrader 5 integration offers professional-grade charting with advanced indicators and expert advisors. Perfect for traders who prefer the familiar MT5 environment.
cTrader: Known for its superior execution speeds and user-friendly interface. Ideal for scalpers and day traders who need lightning-fast order processing.
DerivX: The web-based platform that doesn’t require downloads. Access your charts from any browser, anywhere in the world.
Each platform offers unique advantages, but they all provide the same high-quality Boom 1000 data feed. Your choice depends on your trading style and technical preferences.
BOOM 1000 INDEX TRADINGVIEW INTEGRATION
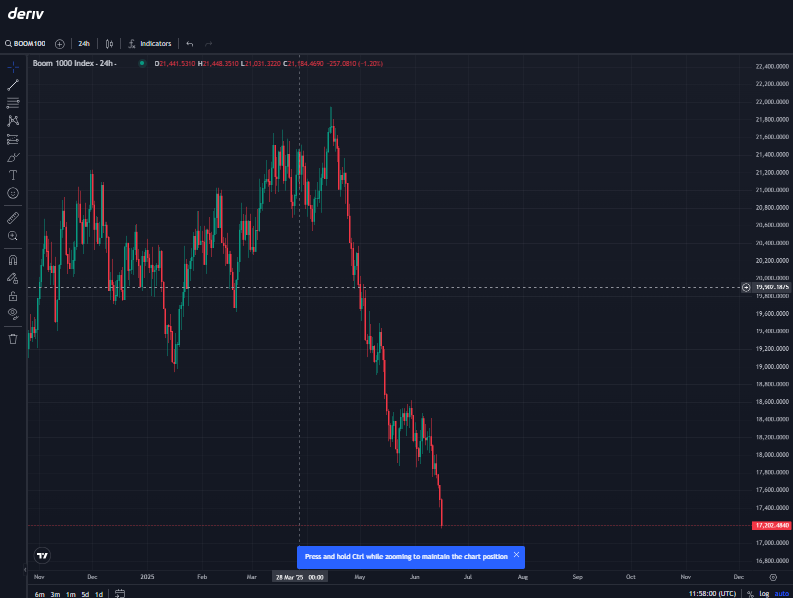
Boom 1000 index TradingView represents one of Deriv’s most innovative additions to their ecosystem. This integration brings professional-grade analysis tools directly to your fingertips.
The platform combines TradingView’s renowned charting capabilities with Deriv’s reliable execution.
You get access to hundreds of technical indicators, drawing tools, and market analysis features that were previously reserved for institutional traders.
Key features include:
- Advanced charting with multiple timeframes
- Custom indicator development
- Social trading insights from the TradingView community
- Real-time market data and execution
This integration particularly benefits traders who rely on complex technical analysis.
The seamless transition from analysis to execution eliminates the friction that often costs traders profitable opportunities.
DOES BOOM 1000 AND BOOM 500 MOVE THE SAME?
This question reveals a common misunderstanding about synthetic indices. Boom 1000 and Boom 500 do not move identically. While both are part of the Boom family, they have distinct characteristics:
Boom 500 experiences more frequent spikes (approximately every 500 ticks on average), creating a more volatile trading environment.
Boom 1000 has less frequent but potentially larger spikes (every 1000 ticks on average), offering different risk-reward profiles.
The correlation between them isn’t perfect. You might see Boom 500 spiking while Boom 1000 remains relatively stable, and vice versa. This difference creates unique arbitrage opportunities for savvy traders who understand both instruments.
BROKER CONSIDERATIONS BEYOND DERIV
While Deriv dominates the Boom 1000 space, the synthetic indices landscape extends beyond a single provider.
If you’re wondering which broker has Boom and Crash index access, you’ll find that most brokers develop their own synthetic products rather than offering Deriv’s specific indices.
This means exploring alternatives that provide similar volatility patterns but with different underlying mathematical models.
Most traders ask about HFM Broker as an alternative, this we have answerd in our guide: Does HFM trade synthetic indices?
RISK MANAGEMENT ESSENTIALS
Trading Boom 1000 requires disciplined risk management. The synthetic nature means traditional correlation analysis doesn’t apply, but position sizing becomes even more critical.
Never risk more than 2% of your account on a single Boom 1000 trade.
The instrument’s volatility can quickly turn small losses into account threatening disasters. Use stop-losses religiously, and consider the spike potential when setting your risk parameters.
CONCLUSION
Boom 1000 index brokers offer exciting opportunities for traders willing to master synthetic indices.
While Deriv leads the pack with comprehensive platform options and reliable execution, success ultimately depends on your analytical skills and risk management discipline.
The key lies in combining higher timeframe trend analysis with precise support and resistance levels.
Whether you’re accessing charts through MT5, cTrader, or the innovative TradingView integration, the tools are there now it’s time to put them to work.
Ready to dive into Boom 1000 trading? Start with a demo account, practice your analysis skills, and gradually build your confidence.
The synthetic indices market rewards patience and precision two qualities that separate profitable traders from the crowd.
Post a Reply
You must be logged in to post a comment.