
 English
 German
  Italian
  Hi, User
 Which Time Frame is Best for Identifying Supply and Demand Zones
Ever feel like you’re spotting perfect supply and demand zones, only to watch the market completely ignore them?
You mark your zone, set your entry, and wait with confidence, then price blows right through it like it never existed.
The frustration is real. You start wondering: “Am I using the wrong time frame? Should I be looking at the 4-hour instead of the 1-hour? Maybe the daily chart is the secret?”
Here’s the truth that nobody wants to hear: there is no “best” time frame for identifying supply and demand zones.
This might sound disappointing at first, but understanding why this is true will completely transform how you approach forex trading.
The real question isn’t about finding a magic time frame. It’s about understanding trading Forex in context.

Supply and demand zones don’t work in isolation—they work within the context of what the market is doing right now.
Trading is reactive, not predictive. When you grasp this principle, you’ll stop chasing the Holy Grail of the “perfect” time frame and start reading the market as it unfolds.
In this guide, I’ll show you exactly how to identify valid supply and demand zones on any time frame by focusing on three critical elements: the dominant trend, market highs and lows, and breaks of structure.
By the end, you’ll understand why context matters more than the time frame you choose, and you’ll have a clear framework for spotting zones that actually hold.

Understanding Context: Why There’s No “Best” Time Frame
Let’s get this straight from the beginning: the concept of a “best” time frame is a trap that keeps traders stuck in a cycle of constantly switching charts, looking for some magical setting that will finally make everything click.
Supply and demand zones exist on every time frame—from the 1-minute chart all the way up to the monthly.
The 15-minute chart shows supply and demand. The 4-hour chart shows supply and demand. The daily chart shows supply and demand. They’re all valid in their own context.
The reason traders get confused is that they treat supply and demand zones as fixed, unchanging areas on a chart.
They think, “I’ll find the zone on the daily chart, then zoom into the 15-minute to get a better entry.” This approach ignores the most important aspect of price action trading: the market is constantly evolving, and what matters is what the market is doing RIGHT NOW.
Think about it this way: a supply zone on the daily chart represents where selling pressure overwhelmed buying pressure on a larger scale.

But within that daily supply zone, there might be demand zones on the 1-hour chart where buyers stepped in temporarily. Which one is “correct”? Both are correct within their own context.
The key insight is this: supply and demand zones are only valid when they align with the current market structure and the prevailing trend in real time.
A demand zone at a market high is worthless. A supply zone at a market low is meaningless. Context is everything.
This is why professional traders don’t ask “what time frame should I use?” Instead, they ask: “What is the market doing right now? What is the dominant trend? Where are we in the market structure? Has there been a break of structure?”
When you shift your focus from finding the “best” time frame to reading the market in context, something powerful happens.
You stop getting caught in false zones. You stop fighting the trend. You start trading with the market instead of against it.
The Three Pillars of Valid Supply and Demand Zones
Now that you understand context matters more than time frame, let me break down the three essential elements that make a supply or demand zone actually valid.
Think of these as non-negotiable requirements. If any one of these is missing, your zone is questionable at best.
1. Trade With the Prevailing or Dominant Trend
The first rule of valid supply and demand zones is simple but often ignored: always identify the dominant trend before marking any zone.
The dominant trend is the overall direction the market is moving. Is the market making higher highs and higher lows (uptrend)?
Is it making lower highs and lower lows (downtrend)? Or is it chopping sideways with no clear direction (ranging)?
Here’s why this matters: in an uptrend, demand zones are your primary focus because the market has proven that buyers are in control.
Supply zones might exist, but they’re less reliable because you’re fighting against the dominant force. The opposite is true in a downtrend—supply zones at market highs are where you want to focus.
Many traders make the critical mistake of treating all zones equally. They see an engulfing candle and immediately mark it as a supply or demand zone without considering the bigger picture.
This is like trying to swim against a river current—you might make some progress, but you’re working much harder than necessary and fighting against natural force.
When you trade with the dominant trend, you’re aligning yourself with institutional money flow. Banks and large financial institutions don’t try to pick tops and bottoms; they follow and create the trend.
When you identify the trend first, you’re positioning yourself on the same side as the big players.
Practical application: Before marking any supply or demand zone, zoom out. Look at the higher time frame (if you’re trading the 1-hour, check the 4-hour or daily).
Ask yourself: “What is the clear trend direction right now?” Once you’ve identified it, only look for supply zones at highs during downtrends, and demand zones at lows during uptrends.
2. Supply Zones at Market Highs, Demand Zones at Market Lows
This is where most traders go wrong, and it’s costing them money trade after trade.
A supply zone is only valid when it forms at a market high—a point where price has pushed up and created a peak in the current market structure.
A demand zone is only valid when it forms at a market low—a point where price has declined and created a trough.
The mistake? Traders see a big bearish engulfing candle in the middle of an uptrend and mark it as a supply zone.
Or they see a bullish engulfing candle in the middle of a downtrend and mark it as a demand zone. These are not valid zones—they’re just pullbacks within the larger trend.
Let me be crystal clear: an engulfing candle alone does not create a supply or demand zone. The candle formation is just one piece of evidence. The location matters just as much, if not more.
Think about the psychology behind this. A supply zone at a high represents a point where sellers stepped in with enough force to stop and reverse an upward move.
It’s the point where the market reached a level that institutions deemed “too expensive” and began selling aggressively. That’s only meaningful at a high—at the extreme point of the move.
Similarly, a demand zone at a low represents a point where buyers saw value and stepped in to prevent further decline.
Large players decided “this is cheap enough” and began accumulating positions. This only makes sense at a low—at the bottom of a decline.
When you mark supply zones in the middle of uptrends or demand zones in the middle of downtrends, you’re essentially betting on reversals in the middle of momentum.
You’re trying to catch falling knives or stand in front of moving trains. The market has not given you evidence that the trend is exhausted—it’s just taking a breath before continuing.
Here’s your checklist:
- Supply zone: Must form after an upward movement reaches a clear high point
- Demand zone: Must form after a downward movement reaches a clear low point
- If the price is in the middle of a trend, it’s not a valid supply or demand zone—it’s a pullback area
3. Supply and Demand After Break of Structure (BOS)
This is the game-changer that separates amateurs from professionals. A supply or demand zone only becomes truly valid after a break of structure occurs.
What is a break of structure? It’s when price breaks through the most recent significant high or low, signaling a shift in market dynamics and confirming the strength of the zone you’ve identified.
For a supply zone to be valid, price must break below the most recent low after forming at a high. This break of structure confirms that sellers have actually taken control and are pushing price lower.
Without this break, you just have a rejection at a high, which could easily reverse and continue upward.
For a demand zone to be valid, price must break above the most recent high after forming at a low. This break confirms that buyers have actually stepped in with conviction and are driving price higher.
Without this confirmation, you’re just guessing that the low will hold.
This is the element that adds confirmation to your zones. It’s the difference between “price touched this area and formed a candle pattern” versus “price touched this area, formed a pattern, AND proved its strength by breaking structure.”
Why does break of structure matter so much? Because it shows you that the supply or demand at that zone was strong enough to completely shift the market’s direction.
It’s not just a temporary pause—it’s a genuine change in control.
Without a break of structure, you’re entering trades based on hope rather than evidence. You’re assuming that because price formed an engulfing candle at a certain level, it will respect that level.
But the market doesn’t care about your assumptions—it only responds to real buying and selling pressure.
The break of structure requirement forces you to be patient and wait for confirmation. It prevents you from jumping into zones prematurely.
Yes, you might miss the absolute first entry, but you’ll avoid countless false signals and losing trades.
How to Identify Valid Zones on Any Time Frame
Now let’s put this all together with a practical, step-by-step process you can use on any time frame you choose to trade.
Step 1: Identify the Dominant Trend
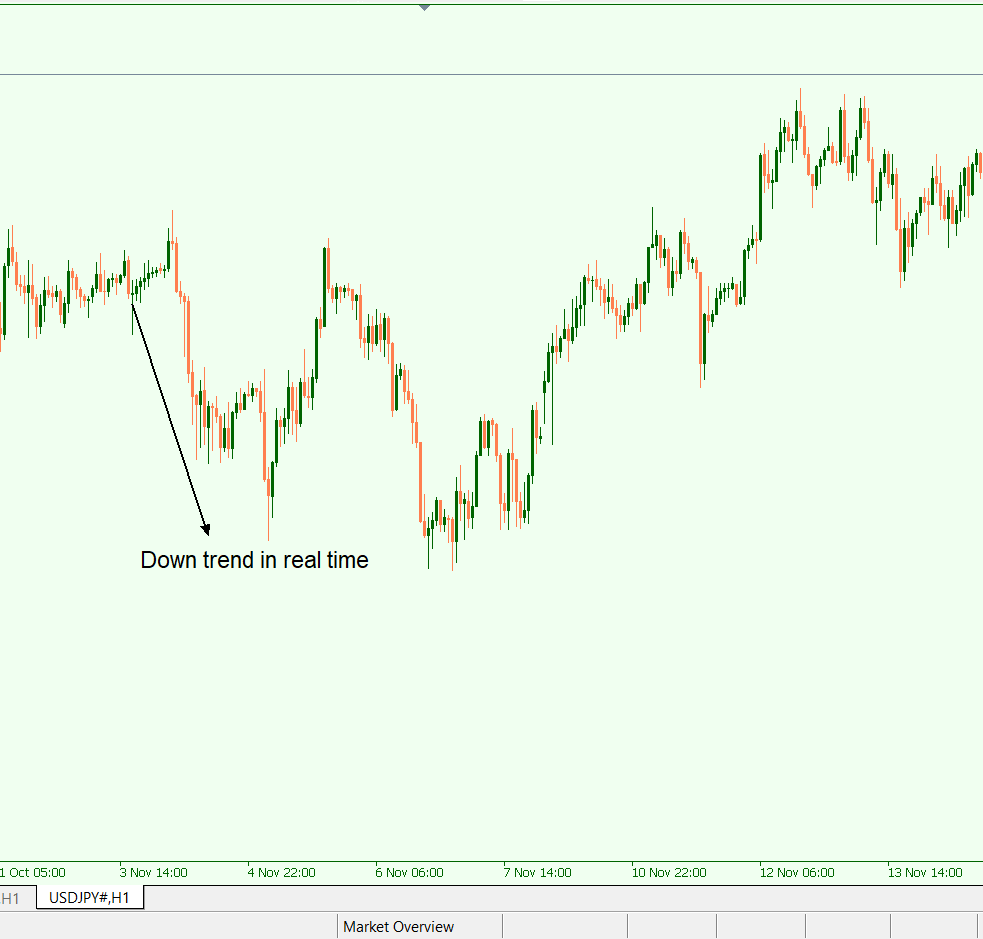
Open your chart and zoom out to see the bigger picture. Look at the last 50-100 candles and ask: Is price making higher highs and higher lows? Lower highs and lower lows? Or moving sideways?
Mark the trend direction with a simple note or arrow on your chart. This is your filter—everything else you do must align with this trend.
Step 2: Locate Market Highs and Lows
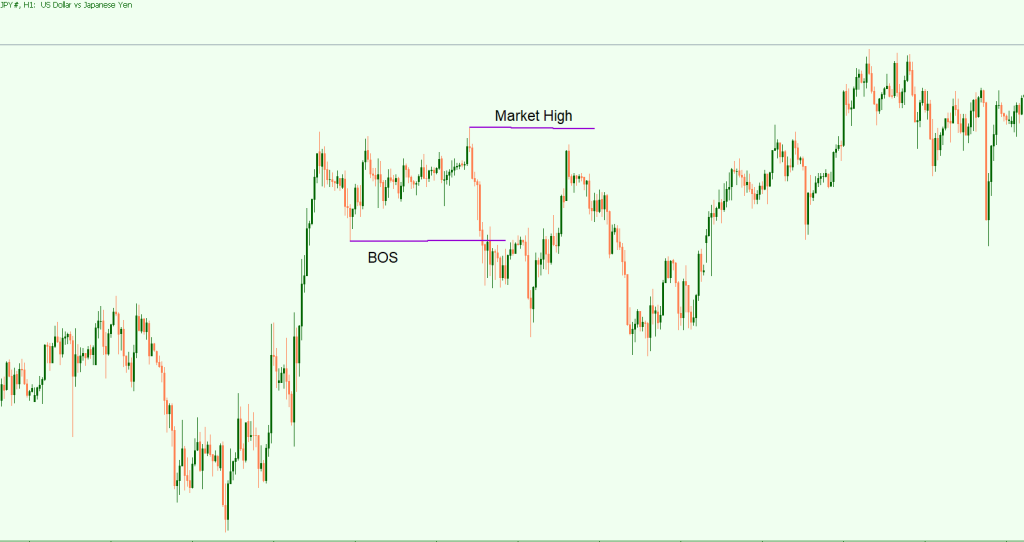
Within the trend you’ve identified, find the most recent significant highs and lows. These are the turning points where price created peaks and troughs before reversing direction.
A market high is where price pushed up and then turned down—creating a peak. A market low is where price pushed down and then turned up—creating a trough. These are your potential supply and demand zone locations.
Don’t overcomplicate this. You’re not looking for every tiny high and low. Focus on the obvious turning points that stand out visually on your chart.
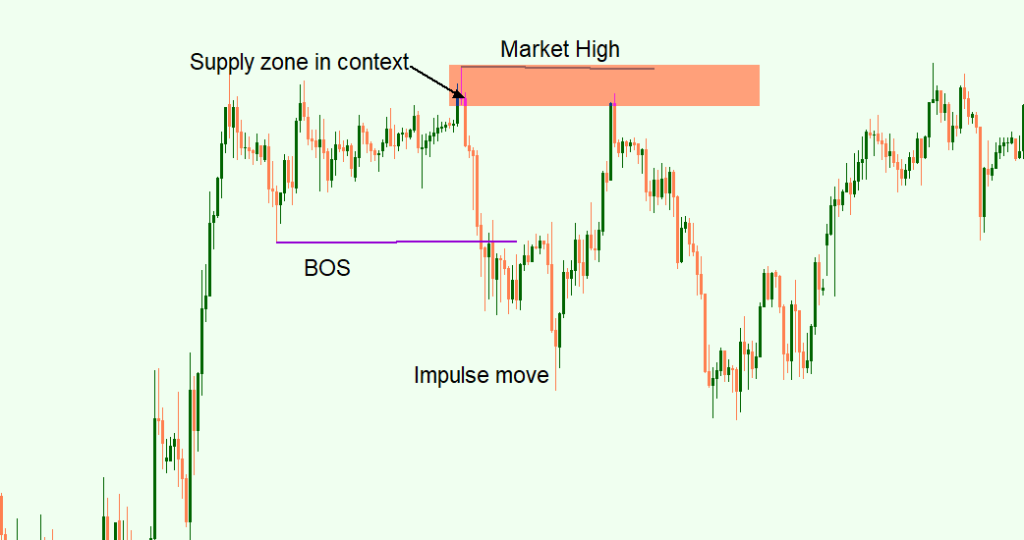
Step 3: Look for the Impulse Move
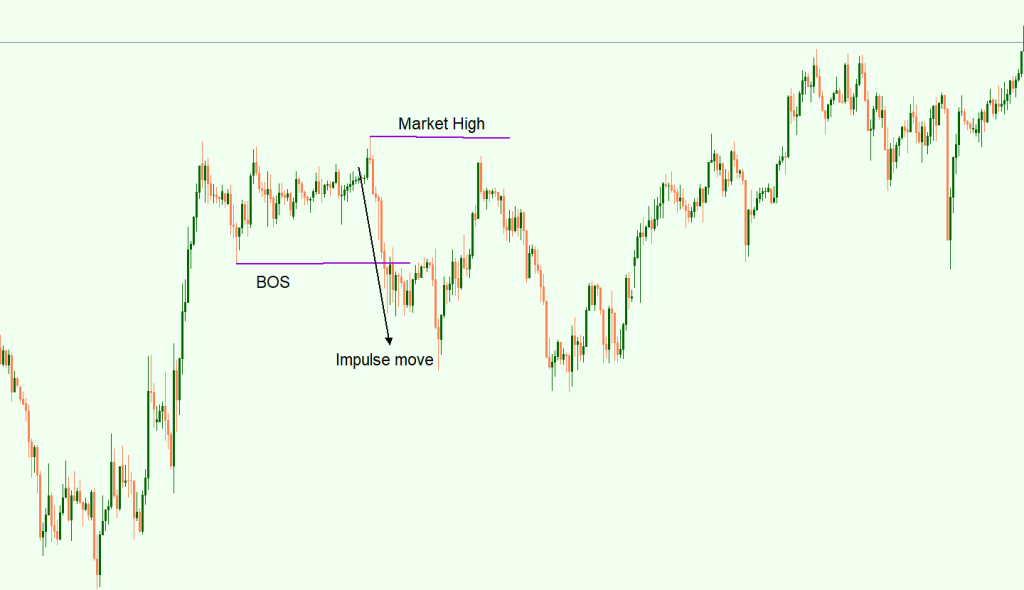
At each high or low you’ve identified, examine what happened immediately after. Did price move away sharply? This sharp move away is called the impulse move, and it indicates strong buying or selling pressure.
At a market high, you want to see a strong bearish impulse move downward. At a market low, you want to see a strong bullish impulse move upward. The stronger and faster this impulse, the better the zone.
The zone itself is the area where price was before the impulse move—the base where institutional orders were placed.
Step 4: Confirm the Break of Structure
This is your confirmation filter. After the impulse move, did price break the most recent opposite extreme?
For supply zones: After forming at a high and moving down, did price break below the previous low? If yes, structure is broken and the supply zone is valid.
For demand zones: After forming at a low and moving up, did price break above the previous high? If yes, structure is broken and the demand zone is valid.
If there’s no break of structure, don’t mark the zone yet. Wait for confirmation or move on to a different area.
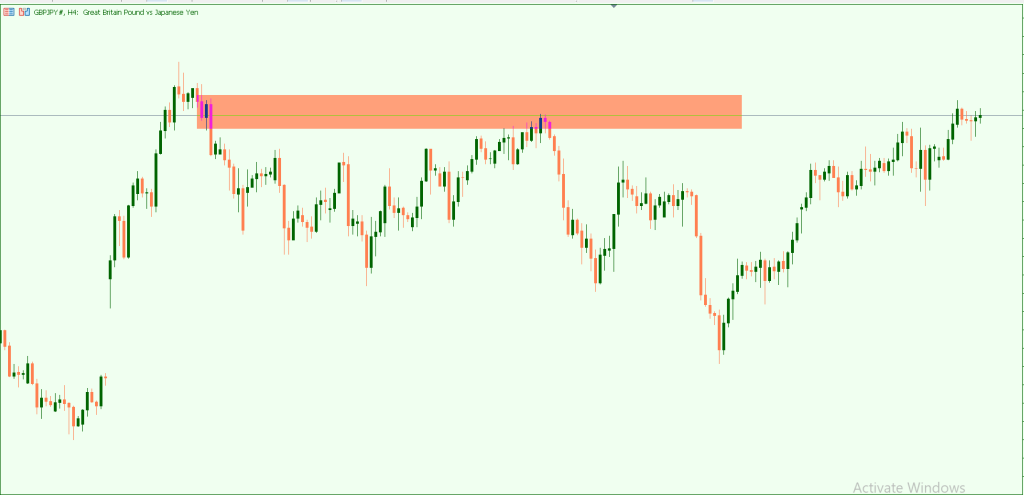
Step 5: Mark Your Zone
Once all three criteria are met (trend alignment, proper location, and break of structure), mark your supply or demand zone. Use a rectangle to highlight the consolidation area before the impulse move.
This is now a high-probability zone that you can trade when price returns to it—but only if the context remains the same. If the trend changes or market structure shifts significantly, your zone may no longer be valid.
Real-Time Context: The Make-or-Break Factor
Here’s something crucial that even experienced traders often overlook: a supply or demand zone that was valid yesterday might not be valid today.
Trading is reactive, not predictive. The market doesn’t care that you marked a beautiful supply zone on your chart last week.
If the market structure has changed, if the trend has reversed, if there’s been a significant fundamental development—your zone’s validity has changed too.
This is what “trading in context” truly means. It means constantly reassessing the market’s current condition and adjusting your zone validity accordingly.
Let’s say you identified a perfect demand zone three days ago. It met all three criteria: formed at a low in an uptrend, showed a strong bullish impulse, and broke structure.
You marked it and waited for price to return. Beautiful setup, right?
But here’s what happened in those three days: the trend shifted. Higher highs and higher lows stopped forming. Price started making lower lows.
The overall market structure changed from bullish to bearish. Now price is approaching your demand zone—but the context has completely changed.
That demand zone is no longer valid. Why? Because it was valid in the context of an uptrend, but we’re no longer in an uptrend.
The market has spoken—it’s now bearish. Trying to buy at that old demand zone would be fighting the new trend.
This is why mechanical trading systems that simply mark zones and trade them blindly fail. The market is dynamic. What works in one market condition doesn’t work in another.
Your job as a price action trader is to be a market detective, constantly reading and re-interacting with what price is telling you right now.
Not what it told you yesterday, not what you hope it will say tomorrow—right now.
Before taking any trade at a supply or demand zone, ask yourself:
- Has the dominant trend changed since I marked this zone?
- Is the market structure still intact?
- Are we still at a relative high (for supply) or low (for demand) in the current context?
- Has there been significant news or fundamental shifts that might have changed market sentiment?
If the answer to any of these questions suggests the context has changed, your zone may no longer be valid—regardless of how perfect it looked when you first identified it.
Common Mistakes That Invalidate Your Zones
Let’s address the most frequent errors traders make when identifying supply and demand zones. Recognizing these mistakes will save you countless losing trades.
Mistake 1: Marking Zones Against the Trend
This is the number one killer of trading accounts. Traders see a strong-looking engulfing candle and immediately mark it as a zone, without checking if it aligns with the dominant trend.
You see a bearish engulfing in an uptrend and mark it as supply, then wonder why price blows through it. The reason is simple: you’re fighting the trend.
The market is bullish, buyers are in control, and your supply zone is just a minor pause before the trend continues.
Solution: Always identify the trend first. In uptrends, focus exclusively on demand zones at lows. In downtrends, focus exclusively on supply zones at highs. Ignore counter-trend zones completely.
Mistake 2: Confusing Pullbacks With Valid Zones
Every time price retraces during a trend, traders rush to mark supply or demand zones. They see an engulfing candle during a pullback and think they’ve found gold.
Here’s the reality: pullbacks are normal and healthy parts of trends. They’re not supply or demand zones—they’re temporary pauses where traders take profits or new participants enter in the direction of the trend.
A true supply zone forms at the extreme high point before a significant reversal. A true demand zone forms at the extreme low point before a significant reversal.
If you’re marking zones in the middle of price moves, you’re marking pullbacks, not zones.
Solution: Only mark zones at clear extremes—obvious peaks in upward moves and obvious troughs in downward moves. If you’re not sure if it’s an extreme, it probably isn’t.
Mistake 3: Ignoring Break of Structure
Many traders mark zones the moment they see a pattern, without waiting for confirmation through a break of structure. This leads to premature entries and false signals.
Just because price formed an engulfing candle at a high doesn’t mean sellers are in control. It could easily be a fake-out before price continues higher.
The break of structure is your confirmation that the zone has actual strength behind it.
Solution: Implement a strict rule—no zone gets marked on your chart until price breaks the most recent opposite extreme. Be patient. Wait for the market to prove the zone’s validity before committing to it.
Mistake 4: Using Too Many Time Frames
Traders open up five or six different time frames, mark zones on all of them, and then wonder why they’re paralyzed by conflicting signals.
More time frames don’t equal better analysis. In fact, they often create confusion and contradiction. What looks like a supply zone on the 15-minute might be inside a demand zone on the 4-hour.
Solution: Choose one primary time frame for identifying your zones (based on your trading style and availability), and use one higher time frame to confirm trend direction. That’s it. Two time frames maximum.
Mistake 5: Forgetting That Zones Expire
Traders mark zones and treat them like permanent fixtures on the chart.
They’ll wait weeks for price to return to a zone they marked, not realizing that the market context has completely changed and the zone is no longer relevant.
Solution: Regularly review your marked zones. Remove or adjust zones when the market structure changes, when the trend shifts, or when price action renders them obsolete.
Keep your charts clean and current.
Practical Trading Strategy for Supply and Demand Zones
Now let’s translate everything into a concrete trading strategy you can implement immediately.
Your Zone Identification Checklist:
Before marking any zone, verify:
- [ ] Dominant trend is clearly identified
- [ ] Zone forms at a market high (supply) or market low (demand)
- [ ] Zone aligns with the current trend direction
- [ ] Strong impulse move away from the zone
- [ ] Break of structure has occurred
- [ ] Current market context still supports the zone
Entry Strategy:
When price returns to a valid supply or demand zone:
- Wait for price to enter the zone area
- Look for confirmation candle patterns (engulfing candles, indecision candles followed by impulse)
- Enter on the close of the confirmation candle or the open of the next candle
- Set your stop loss just beyond the zone (above supply, below demand)
Don’t enter blindly when price touches the zone. Wait for price action confirmation that the zone is being respected.
Stop Loss Placement:
For demand zones: Place your stop loss just below the lowest point of the demand zone, giving the zone a bit of breathing room for normal price fluctuation.
For supply zones: Place your stop loss just above the highest point of the supply zone, again allowing for minor wick extensions.
Your stop loss should be just wide enough to avoid normal market noise but tight enough that if the zone fails, you’re out quickly.
Take Profit Strategy:
Your take profit targets should be based on market structure, not arbitrary risk-reward ratios.
Target the next significant opposite zone: If you’re long from a demand zone, target the next supply zone at a market high. If you’re short from a supply zone, target the next demand zone at a market low.
Alternatively, target the recent high or low that was broken during the structure break that validated your zone. This represents a logical profit target where price may face resistance or support.
Risk Management:
Never risk more than 1-2% of your account on any single trade, regardless of how perfect the zone looks. The market doesn’t care about your analysis—it will do what it wants to do.
Use proper position sizing based on your stop loss distance. A wider stop loss means a smaller position size to maintain your risk percentage.
The Time Frame That Actually Matters: Your Trading Style
After everything we’ve discussed, here’s the practical answer to the original question: the best time frame for identifying supply and demand zones is the one that matches your trading style and time availability.
If you’re a day trader who can watch the charts for several hours per day, the 15-minute to 1-hour time frames will work well for you. You’ll see multiple opportunities and can actively manage your trades.
If you’re a swing trader who checks the charts once or twice per day, the 4-hour and daily time frames are your friends. Zones on these time frames move slower and require less constant monitoring.
If you’re someone with a full-time job who can only check charts in the evening, the daily time frame might be your only practical option—and that’s perfectly fine.
The time frame doesn’t determine the validity of your zones. The three criteria we’ve discussed—trend alignment, proper location, and break of structure—determine validity.
Those principles apply whether you’re looking at a 5-minute chart or a weekly chart.
What matters is consistency. Pick a time frame, master it, and stick with it. Don’t chase opportunities across multiple time frames.
Become an expert at reading one or two time frames, and the profits will follow.
Remember: successful traders aren’t the ones who use the “best” time frame. They’re the ones who understand context, follow their rules consistently, and manage their risk properly.
The time frame is just a tool. How you use it is what matters.
Conclusion: Context Over Time Frame Every Time
Let’s bring this all together with crystal clarity: there is no “best” time frame for identifying supply and demand zones because the time frame itself doesn’t create validity—context does.
You now understand the three pillars that make a supply or demand zone valid on any time frame:
- The zone must align with the prevailing or dominant trend
- Supply zones must form at market highs, demand zones at market lows
- A break of structure must confirm the zone’s strength
These requirements work the same on a 15-minute chart as they do on a daily chart. The principles don’t change—only the speed and frequency of opportunities.
Stop searching for the perfect time frame. Stop constantly switching charts, looking for better setups. Instead, choose a time frame that fits your lifestyle, and master the art of reading context.
Learn to identify the trend, recognize genuine highs and lows, and wait for break of structure confirmation.
Trading is not about finding secrets or magic settings. It’s about understanding what the market is doing right now, in real time, and positioning yourself accordingly.
Supply and demand zones are powerful tools, but only when you use them within the proper context.
Your action steps:
- Choose your primary time frame based on your trading style
- Before marking any zone, identify the dominant trend
- Only mark zones at obvious market highs and lows
- Wait for break of structure before considering a zone valid
- Constantly reassess context—don’t treat old zones as guaranteed
- Practice with a demo account until this process becomes second nature
Remember: the market rewards patience, discipline, and contextual understanding. Master these elements, and the time frame becomes irrelevant.
You’ll spot valid opportunities wherever you look because you’re reading the market, not just the chart.
Post a Reply
You must be logged in to post a comment.