
 English
 German
  Italian
  Hi, User
 Supply and Demand in Forex Trading: The Complete Beginner-to-Pro Guide
Ever placed a trade at what looked like a perfect support level, only to watch the price slice through it like butter? Or maybe you’ve seen the market reverse sharply at certain price zones and wondered, “How did I miss that?”
You’re not alone. Many forex traders struggle to identify the areas where the market is most likely to reverse or continue.
They draw countless horizontal lines on their charts, hoping one will work, but end up confused about which levels actually matter.
Here’s the truth: understanding supply and demand zones is one of the most powerful skills you can develop as a forex trader.
These aren’t just random support and resistance lines; they’re the battlefield zones where institutional money enters the market, creating the explosive price movements you see on your charts.
In this comprehensive guide, I’m going to break down supply and demand trading in a way that finally makes sense.
We’ll cut through the confusion, eliminate the jargon, and give you a clear, step-by-step framework for identifying and trading these powerful zones. By the end of this article, you’ll understand:
- What supply and demand zones really are (and why they’re different from traditional support and resistance)
- How to identify high-probability zones on any timeframe
- The relationship between supply and demand and other price action concepts
- Practical trading strategies for entering, managing, and exiting trades
- Common mistakes that sabotage traders and how to avoid them
Supply and demand in forex trading cannot be overemphasized. It’s a fundamental concept that drives every price movement you see.

Whether you’re a complete beginner or an experienced trader looking to refine your strategy, mastering these zones will dramatically shorten your learning curve and boost your trading confidence.
Let’s dive in and demystify this essential trading concept once and for all.
What Are Supply and Demand Zones in Forex Trading?

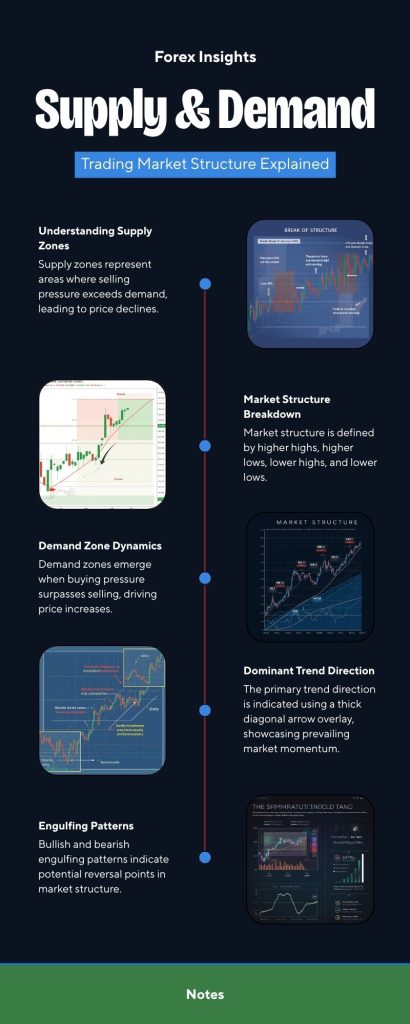
Let’s start with the basics and strip away all the complexity. Supply and demand zones are specific price areas on your chart where significant buying or selling pressure has occurred, creating strong movements away from those zones.
Think of it this way: imagine a coiled spring. When you compress it (accumulation of orders), it stores tremendous energy.
The moment you release it, that spring explodes with force. Supply and demand zones work the same way—they’re areas where large players (banks, institutions, hedge funds) have placed massive orders, creating explosive price movements when triggered.
The Simple Definition
Supply and demand zones in forex trading are key level zones where there are significant market impulses or movements away from the zone, leaving gaps for the price to fill.
These zones can be seen on any timeframe, though zones on higher timeframes tend to be stronger and more reliable.

Let me break this down even further:
Demand Zone (Buying Zone): A price area where buyers overwhelm sellers, causing a sharp upward move. When the price returns to this zone, there’s a high probability that buyers will enter again, pushing the price back up.
Supply Zone (Selling Zone): A price area where sellers overwhelm buyers, causing a sharp downward move.
When the price returns to this zone, there’s a high probability that sellers will enter again, pushing the price back down.
The key phrase here is “significant market impulse.” We’re not talking about slow, grinding price action. We’re looking for explosive moves—the kind that make you sit up and notice because they happen fast and decisively.
Supply and Demand vs. Order Blocks: What’s the Difference?
Here’s something important to know: in the forex trading community, there’s significant overlap between what traders call “supply and demand zones” and what others call “order blocks.”
For the record, many traders use these terms interchangeably.
Both concepts identify the same thing: areas where institutional money has entered the market.
The terminology might differ based on which trading methodology you learned, but the core principle remains identical—you’re looking for zones where big players left their footprint through aggressive buying or selling.
Why Supply and Demand Zones Work
Understanding the psychology behind these zones will make you a better trader. Here’s what’s really happening:
When institutional traders (the big money) want to enter a position, they can’t just place one massive order—it would move the market against them instantly.
Instead, they accumulate their position gradually at specific price levels. Once they’ve filled their orders, they aggressively push the market in their intended direction.
When price returns to these zones later, three powerful forces come into play:
- Fresh Orders: New institutional players see the same attractive price level and place their orders there
- Pending Orders: Some institutions leave pending orders at these zones to add to their positions
- Stop Losses: Traders on the wrong side of the move have their stops clustered here, providing fuel for the reversal
This combination creates a high-probability setup for the price to react strongly when it revisits these zones.
How to Identify High-Quality Supply and Demand Zones
Not all supply and demand zones are created equal. Some will work beautifully, while others will fail spectacularly.
The difference between profitable traders and struggling traders often comes down to their ability to distinguish strong zones from weak ones.
Let me show you exactly what to look for.
The Three Essential Elements of a Valid Zone
Every high-quality supply and demand zone must have these three characteristics:
1. A Fresh Zone (Untested or Lightly Tested)
The best zones are “fresh”—meaning price hasn’t returned to test them multiple times. Think of it like a spring: the first time you release it, it has maximum energy. Each subsequent compression and release weakens it slightly.
A zone that’s been tested once or twice might still be valid, but a zone that’s been touched five or six times has likely had all the orders absorbed. It’s exhausted.
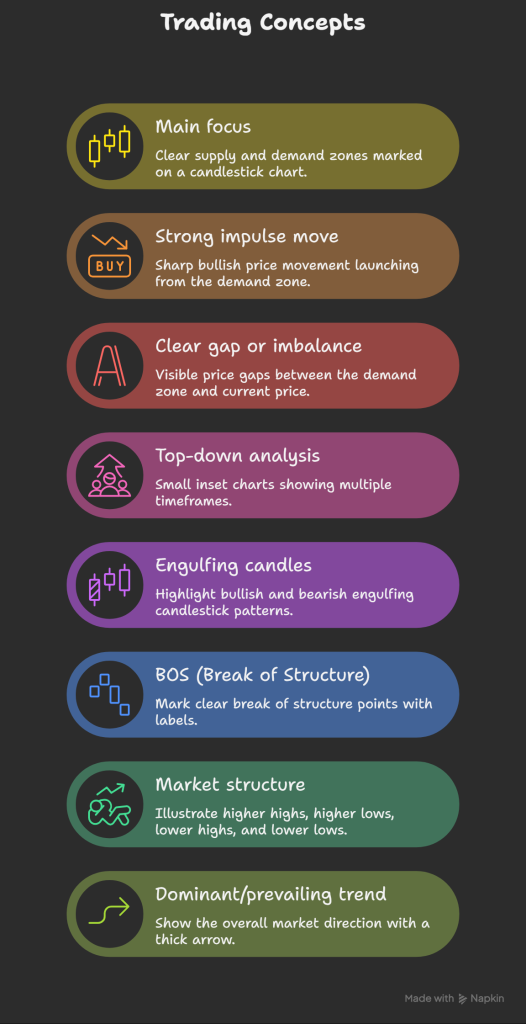
2. A Strong Impulse Move Away from the Zone
This is crucial. Look for an explosive, decisive move away from the zone. The move should be:
- Fast (covering a significant distance in a few candles)
- Clean (minimal pullbacks or hesitation)
- High momentum (large candle bodies, not wicks)
If price slowly grinds away from a level, that’s not a supply or demand zone—it’s just a minor pause in the market. We want zones that show institutional aggression.
3. A Clear Gap or Imbalance Zone
Here’s where supply and demand connect with another powerful price action concept: imbalance zones (also called fair value gaps). When price moves explosively from a zone, it often leaves gaps or imbalances—areas where buyers and sellers weren’t in equilibrium.
These gaps act like magnets. Price has a tendency to “fill” these imbalances, which is why it returns to supply and demand zones. The zone itself represents where the imbalance began.
Step-by-Step: Marking Supply and Demand Zones on Your Chart
Let’s get practical. Here’s your exact process for identifying these zones:
Step 1: Scan for Explosive Price Moves
Start by zooming out on your chart and looking for areas where price made a strong, impulsive move either up or down. Don’t get caught in the weeds yet—just identify the obvious explosive moves.
Step 2: Identify the Base
Once you’ve spotted an impulse move, look at the consolidation or base that formed immediately before the explosion. This base is your zone. It should be relatively compact—not a massive range.
For a demand zone: Find the consolidation before a strong bullish impulse. For a supply zone: Find the consolidation before a strong bearish impulse
Step 3: Mark the Zone Boundaries
Use a rectangle tool to highlight the zone. The boundaries should capture:
- Top: The highest point of the base consolidation
- Bottom: The lowest point of the base consolidation
Keep your zones tight. Wider zones are less precise and give you poor entry points.
Step 4: Validate the Zone
Before you trade this zone, check:
- Is it fresh or has it been tested multiple times?
- Was the move away truly explosive?
- Is there a visible imbalance zone (gap) left behind?
- Does this zone align with the broader market structure?
If you can answer yes to these questions, you’ve identified a high-probability supply or demand zone.
What’s the Best Timeframe for Supply and Demand Trading?
This is one of the most common questions forex traders ask, and my answer might surprise you: there is no single “best” timeframe for supply and demand trading.
Here’s why: when it comes to trading, it’s not ideal to isolate a single concept. Understanding trading in total helps your success rate. You need to use a multi-timeframe approach.
The Power of Top-Down Analysis
Professional traders don’t just trade supply and demand zones blindly.
They employ a technique known as “top-down analysis”—beginning with higher timeframes to gain a broader understanding of the bigger picture, then refining their approach to lower timeframes for more precise entries.
Here’s a typical top-down framework:
- Monthly/Weekly Chart: Identify the overall trend and major supply/demand zones
- Daily Chart: Confirm market structure and find intermediate zones
- 4-Hour Chart: Fine-tune your zones and wait for the price to approach
- 1-Hour Chart: Execute your entry using precise price action signals
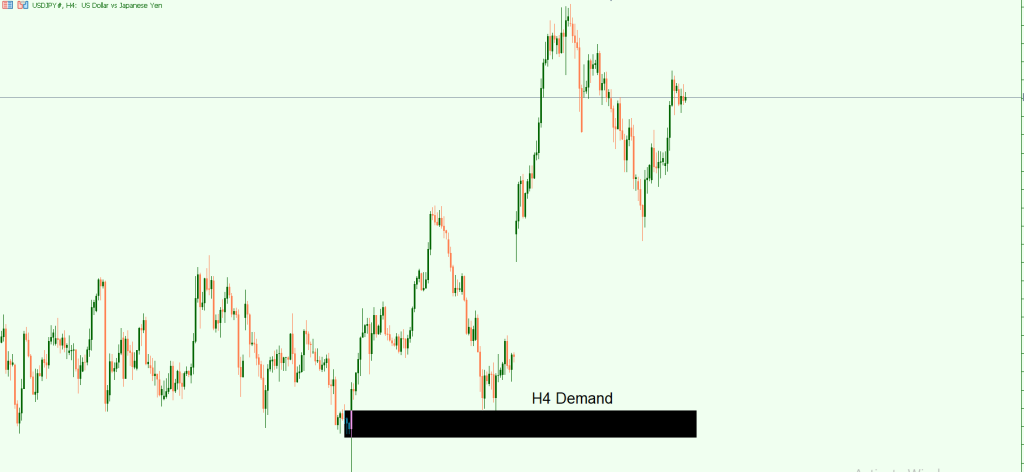
Why Higher Timeframes Matter
Supply and demand zones on higher timeframes (daily, weekly) tend to be stronger and more reliable because they represent larger institutional positions.
These zones have more “behind them”—more orders, more conviction, more money.
A weekly demand zone that’s held for months carries far more weight than an hourly demand zone that formed yesterday.
That said, you can absolutely trade supply and demand on lower timeframes—you just need to understand that these zones will be less reliable and should be confirmed by alignment with higher timeframe structure.
The Golden Rule
Always ensure your supply and demand zones align with the broader market structure. A demand zone that forms against the overall downtrend on higher timeframes is swimming upstream.
It might work, but the odds are stacked against you.
Understanding Market Structure: The Context for Supply and Demand
Here’s a critical truth that separates consistently profitable traders from everyone else: supply and demand zones don’t exist in a vacuum.
To successfully optimize supply and demand trading, you must understand the forex market structure.
Market structure is like reading the story of the chart. It tells you who’s in control (buyers or sellers), where the market is likely headed, and which supply or demand zones are worth trading.
The Three Market Structures
Every market exists in one of three states:
1. Uptrend (Higher Highs and Higher Lows)
In an uptrend, the price creates a series of higher peaks and higher valleys. This tells you buyers are in control. Each pullback (retracement) creates a potential demand zone where buyers will likely step back in.
In this environment:
- Focus primarily on demand zones (buying opportunities)
- Look for supply zones only if you spot a clear market structure break
2. Downtrend (Lower Highs and Lower Lows)
In a downtrend, the price creates a series of lower peaks and lower valleys. Sellers are in control. Each retracement creates a potential supply zone where sellers will likely re-enter.
In this environment:
- Focus primarily on supply zones (selling opportunities)
- Be cautious about demand zones unless the structure is breaking
3. Range (Horizontal Consolidation)
In a range, price bounces between defined upper and lower boundaries without creating new highs or lows. The market is in equilibrium.
In this environment:
- The top of the range acts as supply
- The bottom of the range acts as demand
- Trade both sides, but be ready for a breakout
How Market Structure Transforms Your Supply and Demand Trading
Let me give you a practical example of why this matters:
Imagine you spot a perfect-looking demand zone on the 1-hour chart. It has all the characteristics we discussed: fresh zone, explosive move away, and clear imbalance. You’re ready to buy.
But when you zoom out to the daily chart, you notice the market is in a clear downtrend, printing lower lows. That demand zone is forming at a point where the market is likely to create another lower high before continuing down.
Without understanding market structure, you’d take that trade and probably lose. With market structure awareness, you recognize this is a low-probability setup and pass on it—saving yourself a losing trade.
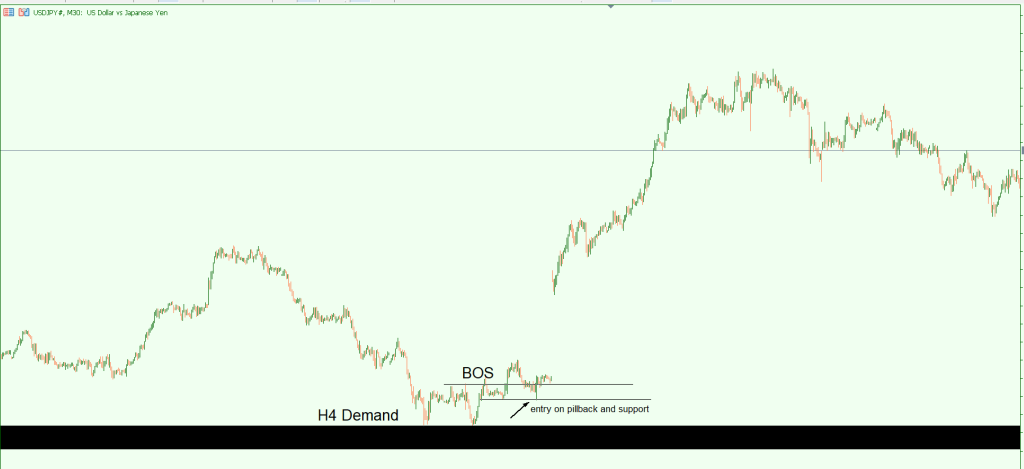
The Break of Structure (BOS)
One of the most powerful concepts in combining supply and demand with market structure is the “break of structure.” This occurs when price breaks a significant high (in a downtrend) or low (in an uptrend), signaling a potential trend change.
When you see a break in the structure:
- The old trend is potentially ending
- Supply zones (in a former uptrend) or demand zones (in a former downtrend) become less reliable
- You should wait for the new trend to establish before taking directional trades
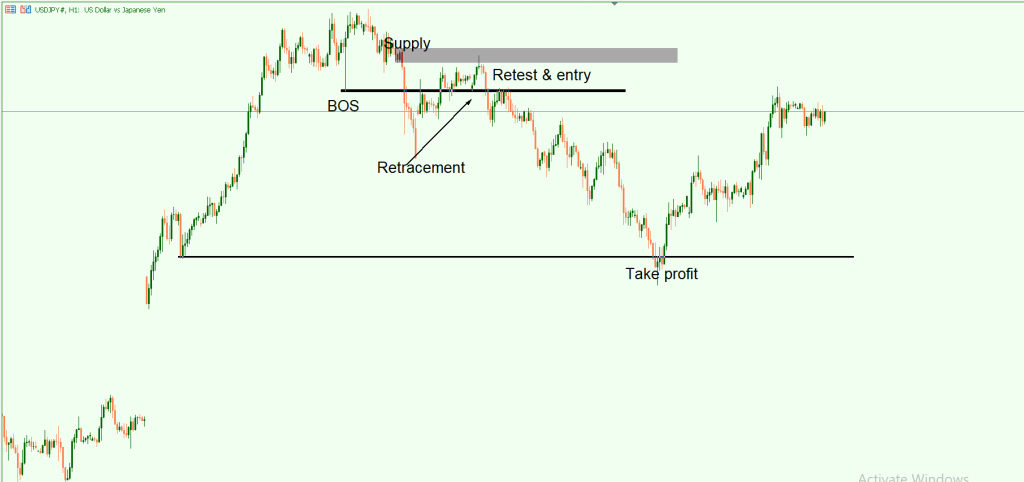
Retracement: Where Supply and Demand Come to Life
After an impulse move and break of structure, the market typically retraces. This retracement is where supply and demand zones become actionable trading opportunities.
The pattern looks like this:
- Impulse: Strong directional move
- Break of Structure: Price breaks a key high or low
- Retracement: Price pulls back to fill imbalances and test a zone
- Continuation: Price resumes in the impulse direction
This sequence is the heartbeat of forex price action. When you can identify this pattern and align it with supply and demand zones, you’ve unlocked one of the most reliable trading setups in the market.
Advanced Price Action Concepts: Confluence with Supply and Demand
To take your supply and demand trading to the next level, you need to understand how this concept connects with other powerful price action signals.
When multiple factors align at a supply or demand zone, your probability of success increases dramatically.
Indecision Candles at Supply and Demand Zones
An indecision candle (such as a doji, spinning top, or high-wave candle) appears when buyers and sellers are in equilibrium, neither side gaining control.
These candles have small bodies relative to their wicks, showing rejection from both directions.
When an indecision candle forms at a supply or demand zone, it’s a powerful warning signal:
At a Demand Zone: An indecision candle suggests buyers are starting to step in, but haven’t yet taken full control. This often precedes a bullish reversal.
At a Supply Zone: An indecision candle suggests sellers are starting to apply pressure, but haven’t yet taken full control. This often precedes a bearish reversal.
The presence of indecision in your zone increases the probability of a reversal because it shows the market is recognizing that level as significant.
Engulfing Candles: Confirmation Signals
An engulfing candle is one of the most powerful reversal patterns in price action trading. It occurs when a candle completely engulfs (covers) the body of the previous candle, showing a dramatic shift in momentum.
Bullish Engulfing at Demand: When the price reaches a demand zone and forms a bullish engulfing candle, it confirms that buyers have taken control. The larger the engulfing candle, the stronger the reversal signal.
Bearish Engulfing at Supply: When the price reaches a supply zone and forms a bearish engulfing candle, it confirms that sellers have taken control.
Many professional traders wait for an engulfing candle at their supply or demand zone before entering a trade. This confirmation reduces false signals and increases win rates.
The Complete Confluence Checklist
When evaluating a supply or demand zone, use this checklist to assess its quality:
- [ ] Zone aligns with higher timeframe market structure
- [ ] Zone is fresh or lightly tested
- [ ] Strong impulse move created the zone
- [ ] Visible imbalance zone exists
- [ ] Zone coincides with a significant market structure point (previous swing high/low)
- [ ] Price forms an indecision candle at the zone
- [ ] Price forms an engulfing candle for confirmation
- [ ] Risk-reward ratio is favorable (minimum 1:2)
The more boxes you can check, the higher your probability of success. Don’t feel like you need all of them—but aim for at least 4-5 confluences before taking a trade.
Practical Trading Strategies: How to Trade Supply and Demand Zones
Theory is valuable, but execution is what pays the bills. Let’s get into the practical details of how to enter, manage, and exit trades using supply and demand zones.
Strategy 1: The Fresh Zone Entry
This is the highest probability setup and the one professional traders hunt for relentlessly.
Setup:
- Identify a fresh supply or demand zone (never tested or tested once)
- Confirm it aligns with market structure
- Wait for the price to return to the zone
Entry:
- Aggressive Entry: Enter as soon as the price touches the zone boundary
- Conservative Entry: Wait for confirmation (indecision candle or engulfing candle at the zone)
Stop Loss Placement:
- Place your stop loss just beyond the opposite side of the zone
- For demand zones: 5-10 pips below the zone bottom
- For supply zones: 5-10 pips above the zone top
Take Profit:
- Target the next opposing supply or demand zone
- Or use a fixed risk-reward ratio (minimum 1:2, ideally 1:3 or higher)
- Consider scaling out: take 50% profit at 1:2 RR, let the remainder run to 1:4+
Risk Management:
- Risk no more than 1-2% of your account per trade
- Ensure your risk-reward ratio is at least 1:2 before entering
Strategy 2: The Market Structure Break and Retest
This strategy combines supply and demand with structural shifts in the market.
Setup:
- Identify a clear trend (uptrend or downtrend)
- Wait for a break of structure (break of key high in downtrend, or key low in uptrend)
- Price creates a new supply or demand zone after the break
- Price retraces to retest the break point
Entry:
- Enter when the price returns to test the broken structure, which now acts as a supply or demand zone
- Wait for a confirmation candle
Stop Loss:
- Place beyond the zone, similar to Strategy 1
Take Profit:
- Target the recent high (if buying) or low (if selling)
- Trail your stop to lock in profits as the new trend develops
This is a powerful trend-following strategy because you’re entering in the direction of the new structural bias.
Strategy 3: Multiple Timeframe Confirmation
This approach uses top-down analysis for high-probability entries.
Setup:
- Weekly/Daily: Identify major supply or demand zone and overall market structure
- 4-Hour: Confirm price is approaching the weekly/daily zone
- 1-Hour: Wait for price to create a smaller supply or demand zone within the larger zone
- 15-Min: Enter on a confirmation candle
Entry:
- Use the 15-minute or 1-hour confirmation to enter in the direction of the higher timeframe setup
Stop Loss:
- Based on the lower timeframe zone
Take Profit:
- Based on the higher timeframe target
This strategy gives you the probability of higher timeframe zones with the precision of lower timeframe entries, optimizing your risk-reward ratio.
Managing Trades: What to Do After Entry
Getting into a trade is only half the battle. Here’s how to manage your positions:
If Price Moves in Your Favor Quickly:
- Consider taking partial profits at 1:1 or 1:2 risk-reward
- Move your stop loss to breakeven after price moves 50% toward your target
- Let a portion run to capture bigger moves
If Price Consolidates at Your Entry:
- Be patient—zones can take time to work
- Don’t exit prematurely unless structure breaks against you
- Trust your analysis and original risk parameters
If Price Starts Moving Against You:
- Don’t move your stop loss further away
- Accept the loss if your stop is hit
- Re-analyze: Did you miss something in your structure analysis?
Trailing Stops:
For trending moves after a successful zone test, consider trailing your stop loss behind each new swing low (in uptrends) or swing high (in downtrends).
This locks in profits while giving the trade room to breathe.
Common Mistakes Traders Make with Supply and Demand
Even with a solid understanding of supply and demand zones, many traders sabotage their own success. Let’s identify the most common pitfalls so you can avoid them.
Mistake 1: Trading Every Zone They See
The rookie mistake: marking up your chart with dozens of zones and trying to trade all of them. This creates analysis paralysis and leads to overtrading.
The Fix: Focus on quality over quantity. Only trade zones that meet your strict criteria: fresh, strong impulse, aligned with structure, and higher timeframe confirmation.
If you’re seeing more than 2-3 valid zones on your chart at any time, you’re probably marking too many.
Mistake 2: Ignoring Market Structure
Trading supply and demand zones against the prevailing trend or market structure is like swimming against a riptide. You might succeed occasionally, but the odds are against you.
The Fix: Always start with market structure analysis. Identify the trend on higher timeframes before looking for supply and demand zones.
Only trade zones that align with the broader structural bias. In an uptrend, prioritize demand zones. In a downtrend, prioritize supply zones.
Mistake 3: Using Zones That Have Been Tested Multiple Times
A zone that’s been tested four or five times is exhausted. The institutional orders that created it have been filled. Continuing to trade these zones is a losing proposition.
The Fix: Focus on fresh zones or zones that have been tested only once. Once a zone has been tested twice without producing a strong reaction, remove it from your chart. Don’t fall in love with old zones.
Mistake 4: Poor Stop Loss Placement
Some traders place stops too tight (just inside the zone), getting stopped out by wicks before the zone works. Others place stops too wide, risking too much capital per trade.
The Fix: Place your stop just beyond the zone boundary with a small buffer (5-10 pips). This accounts for minor stop hunts while still invalidating the zone if it truly breaks.
Calculate your position size based on this stop placement—never risk more than 1-2% per trade.
Mistake 5: Taking Profits Too Early
Exiting at the first sign of profit is leaving massive money on the table. Supply and demand zones, when they work, often produce large moves.
The Fix: Set profit targets based on the next supply or demand zone, not arbitrary pip amounts.
Use a profit-taking plan: take partial profits at conservative targets (1:2), then let a portion run to more aggressive targets (1:4+). This balances security with upside potential.
Mistake 6: Failing to Wait for Confirmation
Aggressive entries can work, but they have a lower success rate. Entering every time the price touches a zone without waiting for confirmation leads to frustration and losses.
The Fix: Especially when you’re learning, wait for confirmation. Look for indecision candles, engulfing patterns, or other reversal signals in your zone before entering.
Yes, you might miss some moves—but you’ll avoid many false signals.
Mistake 7: Not Adapting to Different Market Conditions
Supply and demand zones behave differently in trending vs. ranging markets. Trying to use the same approach in all conditions reduces effectiveness.
The Fix: Adjust your strategy based on market conditions:
- Trending markets: Trade with the trend at demand (uptrend) or supply (downtrend) zones
- Ranging markets: Trade both supply and demand at range boundaries
- Breakout markets: Wait for structure to re-establish before trading zones again.
Real Trading Scenarios: Supply and Demand in Action
Let’s walk through three realistic scenarios that show how these concepts play out in live market conditions.
Scenario 1: EUR/USD Daily Demand Zone in an Uptrend
Context: EUR/USD has been in a clear uptrend on the daily chart, making higher highs and higher lows.
Price creates a strong bullish impulse move, then retraces back toward a daily demand zone that hasn’t been tested yet.
Analysis:
- Market structure: Clear uptrend on the daily timeframe
- Supply/Demand: Fresh demand zone formed at 1.0850-1.0870
- Impulse: Strong 200+ pip bullish move away from the zone
- Imbalance: Visible gap left during the impulse
- Confluence: Zone aligns with previous swing low (market structure point)
Trade Execution:
- Watch as price approaches 1.0870 on the 4-hour chart
- Price enters the zone and forms a doji candle (indecision)
- The next candle is a strong bullish engulfing candle
- Enter long at 1.0875 after the engulfing candle closes
- Stop loss at 1.0840 (below the zone) = 35 pips risk
- Target: Next daily supply zone at 1.1050 = 175 pips reward
- Risk-reward: 1:5
Outcome: Price respects the demand zone and rallies over the next five days to reach the supply zone target. Partial profits taken at 1:2 (70 pips), remainder hits full target for a 5R win.
Key Lesson: When all elements align—fresh zone, market structure, confirmation—the probability of success increases dramatically. These are the setups worth waiting for.
Scenario 2: GBP/JPY 4-Hour Supply Zone After Structure Break
Context: GBP/JPY has been in an uptrend but shows signs of exhaustion. Price fails to make a new high, instead creating a lower high (break of structure).
A sharp bearish impulse follows, creating a fresh supply zone on the 4-hour chart.
Analysis:
- Market structure: Break of structure suggests trend shift
- Supply/Demand: Fresh supply zone at 193.50-193.80
- Impulse: Sharp 150-pip bearish move
- Imbalance: Clear gap in the move down
- Confluence: Supply zone aligns with broken market structure point
Trade Execution:
- Price retraces back to the 193.50-193.80 supply zone
- Wait for confirmation on 1-hour chart
- Price enters the zone and forms a bearish engulfing pattern
- Enter short at 193.60
- Stop loss at 193.90 (above zone) = 30 pips risk
- Target: Recent swing low at 192.00 = 160 pips reward
- Risk-reward: 1:5.3
Outcome: Price rejects the supply zone strongly and drops over the next two days. Target is reached for a full 5R+ win.
Key Lesson: Break of structure combined with fresh supply/demand zones creates powerful reversal setups. These often mark major turning points in the market.
Scenario 3: USD/JPY Range-Bound Trading (The False Breakout)
Context: USD/JPY has been trading in a tight range between 148.00 (demand) and 150.00 (supply) for three weeks.
Price breaks above 150.00, triggering stops and drawing in breakout traders.
Analysis:
- Market structure: Ranging, no clear directional bias
- Supply/Demand: The 150.00 level has acted as supply multiple times
- False Breakout: Price breaks supply by 30 pips then reverses sharply
- New Zone: The false breakout creates a fresh supply zone at 150.10-150.30
Trade Execution (The Trap):
- Novice trader enters long on the breakout at 150.15
- Doesn’t place stop loss immediately
- Price reverses back into the range
- Trader holds, hoping for recovery
- Price falls to 148.50
Outcome: Loss of 150+ pips due to trading against range structure and not respecting the established supply zone.
The Correct Approach: An experienced trader recognizes:
- The range structure is still intact
- False breakouts are common at range boundaries
- The breakout created a fresh supply zone
- They short at 150.20 after the reversal candle
- Stop above 150.50, target the range bottom at 148.00
- Result: 220-pip win
Key Lesson: Understanding broader market context (ranging vs. trending) is essential.
Supply and demand zones at range boundaries often produce false breakouts that create excellent counter-trend opportunities—but only if you recognize the ranging structure.
Optimizing Your Supply and Demand Trading System
Now that you understand the core concepts, let’s talk about optimization. How do you turn this knowledge into a consistent, profitable trading system?
Develop a Pre-Trade Checklist
Don’t trade on impulse or emotion. Create a checklist that every potential trade must pass before you risk capital:
Pre-Entry Checklist:
- ✓ Is this a fresh or lightly-tested zone?
- ✓ Does the zone have a strong impulse move away from it?
- ✓ Is there a visible imbalance/gap?
- ✓ Does this align with higher timeframe market structure?
- ✓ Am I trading with or against the trend?
- ✓ Is there confirmation (indecision or engulfing candle)?
- ✓ Is my risk-reward ratio at least 1:2?
- ✓ Is my position size correct (1-2% risk maximum)?
- ✓ Do I have a clear plan for stop loss and take profit?
- ✓ Are there any major news events about to be released?
If you can’t check at least 7 out of 10 boxes, pass on the trade. This discipline separates profitable traders from those who struggle.
Keep a Trade Journal
Document every trade you take with supply and demand zones:
- Chart screenshot showing the zone, entry, stop, and target
- Timeframe used
- Market structure context (trend/range/transition)
- Confluence factors present
- Entry trigger (what confirmed the trade)
- Outcome and lessons learned
Review your journal weekly. You’ll quickly identify patterns: which setups work best for you, which timeframes, what mistakes you repeat, and where your edge lies.
Backtest Your Strategy
Before risking real money, prove your strategy works:
- Go back through historical charts
- Identify supply and demand zones using your criteria
- Record hypothetical trades
- Track win rate and average risk-reward
- Aim for: 50%+ win rate with 1:2+ average RR
If your backtest shows profitability over 100+ trades, you have a solid foundation. If not, refine your criteria until you do.
Practice on Demo Before Going Live
Even with a backtested strategy, give yourself time to execute in real-time on a demo account:
- Trade for at least 2-3 months on demo
- Execute at least 50 trades
- Achieve consistent profitability
- Build muscle memory for identifying and executing setups
Only then should you transition to live trading with small position sizes.
Start Small and Scale Gradually
When you go live:
- Start with micro lots or the smallest position size your broker allows
- Focus on execution and emotional control, not profits
- Risk no more than 0.5% per trade initially
- After 20+ winning trades, gradually increase to 1% risk
- After consistent profitability over 3+ months, consider increasing to 1.5-2%
Never jump straight to large position sizes. Building a track record of consistency is more important than maximizing profits early.
Advanced Concepts: Taking Your Supply and Demand Trading Further
Once you’ve mastered the fundamentals, these advanced concepts will help you refine your edge.
Order Block Liquidity Concepts
Supply and demand zones don’t just attract price—they attract liquidity. Understanding liquidity concepts helps you predict market behavior more accurately.
Liquidity Pools: Areas where many stop losses cluster. These typically sit just above supply zones (where buyers place stops) and just below demand zones (where sellers place stops).
Smart money often pushes price into these liquidity pools before reversing. This is called a “stop run” or “liquidity sweep.”
How to Use This: Don’t panic if price briefly pierces your supply or demand zone before reversing. This is often a liquidity sweep, grabbing stops before the true move begins. Allow your stop loss buffer to account for this behavior.
Combining Supply and Demand with Fibonacci
Fibonacci retracement levels (38.2%, 50%, 61.8%) often align with supply and demand zones, creating powerful confluence.
When a Fibonacci level coincides with a supply or demand zone, the probability of a reaction increases significantly. Look for these alignments after strong impulse moves.
The Supply and Demand Flip
One of the most reliable patterns in trading: a supply zone breaking and becoming demand (or vice versa).
When price decisively breaks through a supply zone, that zone often becomes demand on the retest. This is because:
- Previous sellers are now trapped (and might exit for breakeven)
- New buyers see a previous resistance now becoming support
- The structural break indicates a shift in market control
Trade these “flipped” zones with the same criteria as fresh zones.
Conclusion: Your Path to Supply and Demand Mastery
If you’ve made it this far, you now have a comprehensive understanding of supply and demand trading in forex—from the foundational concepts to advanced execution strategies.
Let’s recap the key points that will transform your trading:
Core Concepts:
- Supply and demand zones are areas where institutional money entered aggressively, creating explosive moves
- These zones represent imbalances in the market that price tends to fill
- Higher timeframe zones are more reliable than lower timeframe zones
- Fresh zones have more probability than tested zones
Critical Success Factors:
- Always align your supply and demand zones with market structure
- Use top-down analysis to identify high-probability setups
- Wait for confirmation (indecision or engulfing candles) when learning
- Implement strict risk management (1-2% risk per trade)
- Focus on quality setups, not quantity of trades
Avoiding Common Pitfalls:
- Don’t trade zones against the prevailing trend
- Don’t overtrade every zone you see on your chart
- Don’t ignore market structure context
- Don’t risk too much capital per trade
- Don’t take profits too early—let winners run
Your Action Plan:
- This Week: Review your charts and identify 3-5 clear supply and demand zones using the criteria you’ve learned. Don’t trade them yet—just practice identification.
- Next Two Weeks: On a demo account, start marking zones in real-time. Watch how price behaves when it returns to these zones. Document what you observe.
- Weeks 3-4: Begin taking demo trades at your identified zones. Use the pre-trade checklist. Focus on execution, not profits.
- Month 2-3: Continue demo trading while keeping a detailed trade journal. Review weekly to identify patterns and refine your approach.
- Month 4+: If you’ve achieved consistent profitability on demo (50+ trades with positive results), consider transitioning to live trading with minimal position sizes.
Remember the Golden Rule:
Supply and demand trading is not a standalone concept. To successfully optimize supply and demand trading, you must understand forex market structure and top-down analysis.
These concepts work together as a complete system, not in isolation.
The traders who struggle are those who try to trade every supply and demand zone they see without considering the broader context.
The traders who succeed are those who use supply and demand as one tool within a comprehensive price action framework.
Moving Forward:
You now have the knowledge. What separates you from success is implementation and discipline. Trading is a skill that develops over time through deliberate practice, not overnight through knowledge alone.
Be patient with yourself. Master one timeframe before adding others. Achieve consistency with one currency pair before diversifying.
Build your confidence through small, consistent wins rather than chasing home runs.
The market will always be here. There’s no rush. Focus on becoming a consistently profitable trader, and the profits will follow naturally.
Continue Your Education:
To deepen your understanding of how supply and demand integrates with other price action concepts, explore these related topics:
- Market structure and break of structure patterns
- Imbalance zones and fair value gaps
- Engulfing candles and reversal patterns
- Top-down multi-timeframe analysis
- Risk management and position sizing
Each of these concepts reinforces and enhances your supply and demand trading, creating a comprehensive price action system that works across all market conditions.
Supply and demand in forex trading cannot be over-emphasized—it’s fundamental to understanding how and why price moves.
But it’s the combination of supply and demand with proper market structure analysis, confluence factors, and disciplined execution that creates trading success.
Now it’s your turn. Take what you’ve learned, practice diligently, and watch your trading transform. The path to mastery starts with a single step—and you’ve just taken it.
Post a Reply
You must be logged in to post a comment.