
 English
 German
  Italian
  Hi, User
 Price Action Trading: A Complete Guide to Reading Market Structure Without Indicators
Ever found yourself staring at a chart cluttered with indicators, feeling more confused than confident?
You’re not alone. Many forex traders struggle with the overwhelming noise of technical indicators, only to watch their carefully analyzed trades reverse moments after entry.
The frustration is real—but what if you could strip away all that complexity and read the market like a professional floor trader?
Price action trading is one of the most talked-about topics among traders, and even with the abundance of information available, many traders still find it hard to apply these concepts properly in real market scenarios.
Why? Because in most cases, emotions become louder than price action analysis. The charts tell a clear story, but fear and greed shout over the message.
I’m going to help you master your emotions so that you become confident with your price action analysis and read market structure the right way.
Market structure is a fundamental part of price action, and understanding how these elements work together will transform your trading from guesswork into calculated decision-making.
In this comprehensive guide, you’ll discover what price action trading really means, how to identify high-probability setups without relying on lagging indicators, and how to read the market’s natural rhythm through support and resistance levels, supply and demand zones, and candlestick patterns.

By the end of this article, you’ll understand why naked trading gives you the clearest picture of market behavior and how to apply these timeless principles to any timeframe or currency pair.
Understanding Price Action Trading: The Foundation of Naked Trading
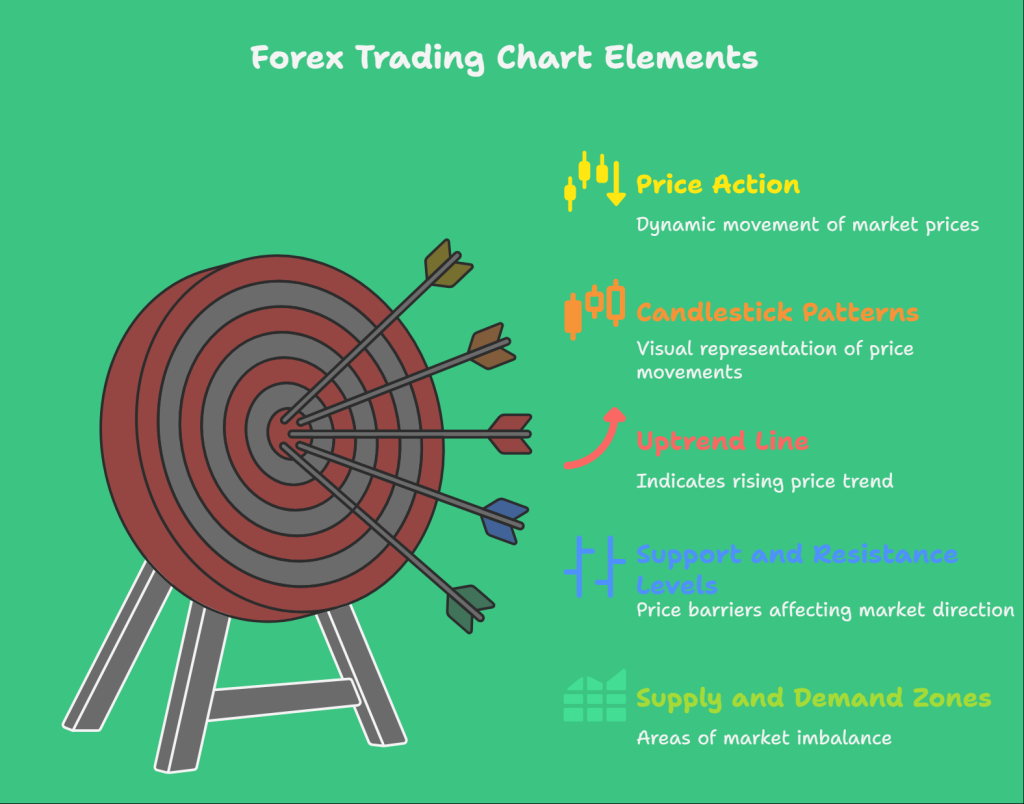
Price action trading simply means using historical price movements to make trading decisions—movements based on support and resistance, major levels, supply and demand zones, imbalance areas, candlestick patterns, and more.

It’s the art of reading what the market is actually doing, rather than what indicators tell you it might do.
Unlike indicator-based systems that rely on mathematical calculations of past prices, price action focuses on the raw price data itself.
This approach gives you a direct window into market psychology—the real-time battle between buyers and sellers that determines where the price will go next.
Think of it this way: indicators are like reading a weather report from yesterday to predict today’s weather. Price action is like looking out the window and seeing the clouds forming right now.
Which gives you better information?
What Makes Price Action Different?
Price action trading ignores the fundamental factors that influence a market’s movement in the moment and focuses primarily on the market’s price history.

At the same time, it does not rely on any technical indicator as a primary source for making trading decisions. It is pure naked trading—you, the chart, and the story that price movement tells.
This doesn’t mean fundamentals don’t matter. Major economic releases can certainly move markets.
But price action traders believe that all available information—fundamental, technical, and psychological—is already reflected in the price.
By reading price structure, you’re reading the collective decision of all market participants.
The Core Philosophy: Simplicity Over Complexity
The beauty of price action is its simplicity. A clean chart with clear levels and recognizable patterns provides more actionable information than a chart covered in oscillators, moving averages, and custom indicators.
Professional traders on institutional desks don’t stare at stochastic crosses or MACD divergences—they watch where buyers and sellers show their hand through price action.
When you strip away the indicator clutter, you’ll notice something remarkable: the market moves in predictable patterns based on human psychology.
Fear and greed manifest in repeating price structures across all timeframes and all markets.
Once you learn to recognize these structures, you gain a significant edge.
The Six Core Concepts That Form Complete Price Action Trading
To fully master price action trading, there are concepts in forex that cannot be ignored.
These are the markers that enable a trader to fully utilize the complete concept of price action.
To put it simply, price action trading is a package, and within that package, you will find six fundamental elements that work together.
1. Supply and Demand: The Engine Behind Price Movement
Supply and demand represent the fundamental economic principle that drives all market movement. When demand exceeds supply, prices rise.
When supply exceeds demand, prices fall. In trading terms, these manifest as zones where price has reacted sharply in the past.
A demand zone forms where buyers overwhelm sellers, causing the price to shoot upward.
A supply zone forms where sellers overwhelmed buyers, forcing price to drop rapidly. These zones often show as areas where price “bases” before making a strong directional move.
The key characteristic of a valid supply or demand zone is the strength and speed of the move away from that zone.
A slow grind away suggests weak imbalance; a sharp, impulsive move indicates strong imbalance. When price returns to these zones, they often act as high-probability turning points.
2. Support and Resistance: Where Price Has Memory
Support and resistance levels mark horizontal areas where price has formally reacted, serving as potential entry and exit points.
Support acts as a floor where buyers step in; resistance acts as a ceiling where sellers emerge.
These levels hold psychological significance because traders remember where the price struggled before.
When price approaches a previous support or resistance level, traders anticipate similar behavior, creating a self-fulfilling prophecy.
The more times a price has touched and respected a level, the more significant that level becomes. However, be aware that support and resistance aren’t precise lines—they’re zones.
Price often penetrates these levels slightly before reversing, which is why your stop losses need appropriate breathing room.
3. Imbalance Zones: The Footprints of Institutional Trading
Imbalance zones, sometimes called fair value gaps or price inefficiencies, appear as areas where the price moved so quickly that normal trading didn’t occur.
On a candlestick chart, these show as gaps between the wick of one candle and the body of a previous candle.
These zones indicate that one side (buyers or sellers) had such overwhelming control that the price literally jumped over normal price levels.
The market often returns to “fill” these imbalances, creating high-probability trading opportunities.
Smart traders mark these zones and wait for the price to return.
When price approaches an imbalance zone that aligns with a supply or demand area, you have confluence—multiple reasons supporting the same trade idea.
4. Candlestick Patterns: Reading Market Psychology Bar by Bar
Candlestick patterns provide a window into the psychology of market participants.
Pin bars, engulfing candles, inside bars, and indecision candles all tell specific stories about the battle between buyers and sellers.
A pin bar (rejection candle) shows that one side tried to push the price in one direction but was overwhelmed by the opposite side, creating a long wick and small body.
This often signals a reversal, especially at key levels.
An engulfing candle occurs when one candle completely engulfs the previous candle, indicating a shift in control.
A bullish engulfing candle at support suggests buyers have seized control; a bearish engulfing candle at resistance suggests sellers are dominating.
Indecision candles (doji, spinning tops) show equilibrium—neither buyers nor sellers have control.
At major turning points, these often precede significant directional moves as one side eventually wins the battle.
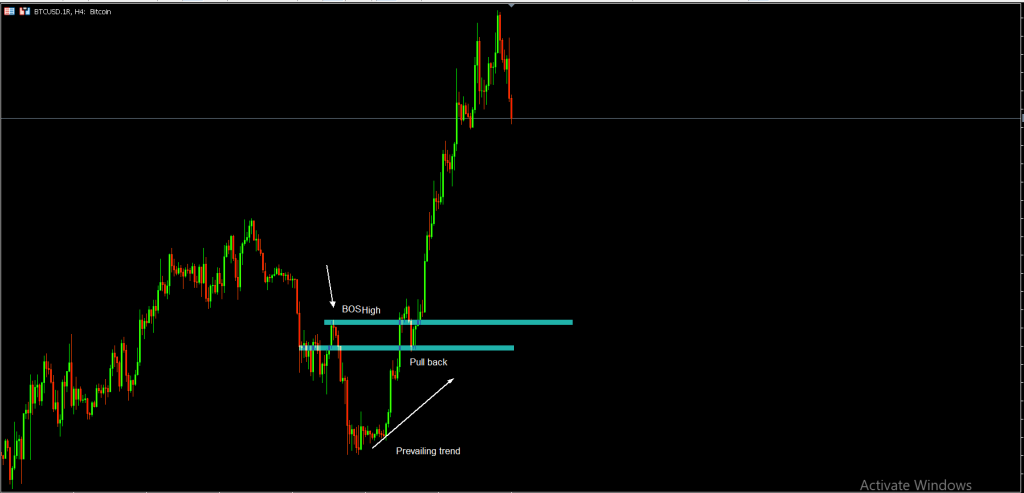
5. Market Structure: The Trend Framework
Market structure analysis involves identifying the trend by recognizing higher highs and higher lows (uptrend), lower highs and lower lows (downtrend), or sideways movement.
Understanding market structure helps you align your trades with the prevailing trend rather than fighting against it.
In an uptrend, price creates a staircase pattern upward, each swing high breaks the previous high, and each pullback finds support above the previous low.
This structure tells you that buyers are in control, and you should look for buying opportunities on pullbacks.
In a downtrend, the opposite occurs: lower highs and lower lows form a descending staircase, indicating seller control.
Trading with the trend dramatically improves your win rate because you’re aligning with the dominant market force.
A break of structure (when an uptrend makes a lower low, or a downtrend makes a higher high) often signals a potential trend change.
These structural breaks create high-probability reversal opportunities when combined with other price action signals.
6. Analyzing Trends: Aligning with Dominant Market Direction
Trend analysis goes beyond simply identifying whether the price is moving up or down—it involves understanding the strength, maturity, and potential exhaustion of the current trend.
Is the trend accelerating or losing momentum? Are pullbacks getting deeper? Are breakouts losing follow-through?
The prevailing trend provides context for every trading decision. Even the strongest support level has less significance if it’s fighting against a powerful downtrend.
Conversely, even weak resistance can hold if a strong uptrend is losing steam and showing exhaustion signals.
Understanding where you are in a trend’s lifecycle—beginning, middle, or potential end—helps you choose appropriate strategies.
Trend continuation strategies work best in the middle phase, while reversal strategies work best at potential exhaustion points marked by multiple price action signals.
Choosing Your Timeframe: Multi-Timeframe Price Action Analysis
There are no best time frames for price action trading, as price action concepts cut across all time frames.
As a trader, if you are able to master price action trading, then you can apply it on any timeframe, keeping in mind that your market analysis starts from the higher timeframe.
The Top-Down Approach: Starting with the Big Picture
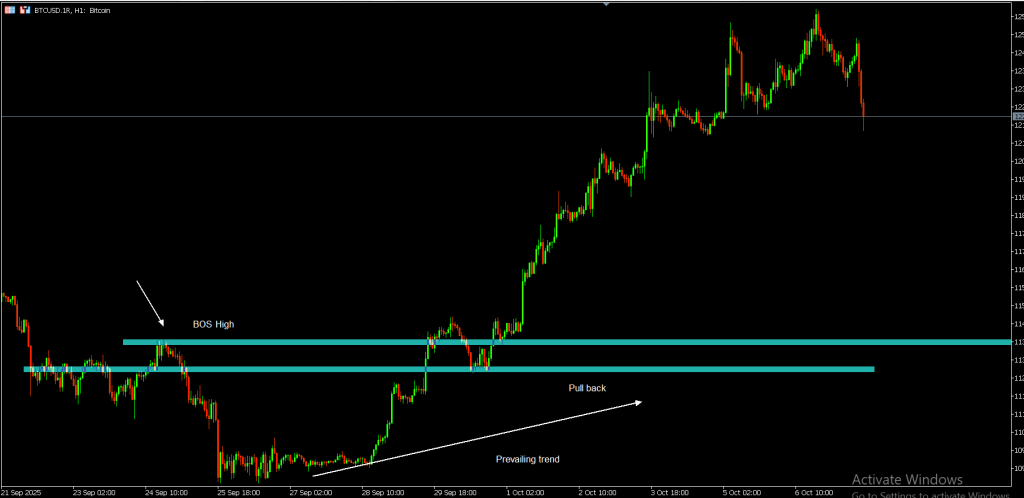
Professional traders use a top-down approach, starting with higher timeframes to identify the dominant trend and key levels, then moving to lower timeframes for precise entry timing.
This approach prevents the common mistake of taking trades that look good on a 15-minute chart but fight against the daily trend.
Begin your analysis on the daily or 4-hour chart. Identify the market structure—is the price in an uptrend, a downtrend, or ranging?
Mark major support and resistance zones, supply and demand areas, and any obvious imbalance zones. This gives you the “big picture” context.
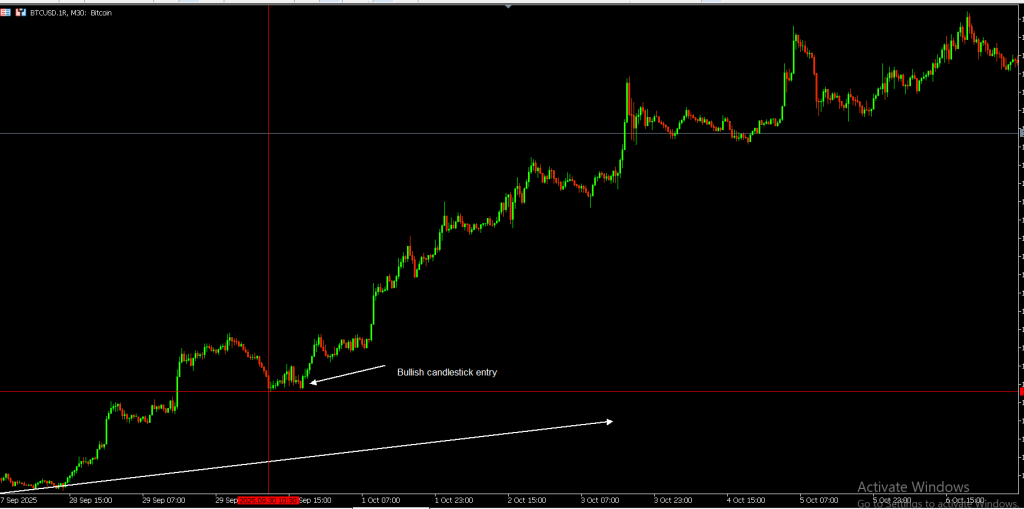
Next, drop down to your trading timeframe (which might be 1-hour, 30-minute, or 15-minute depending on your style).
Look for price action setups that align with the higher timeframe direction.
A bullish pin bar on the 1-hour chart gains significantly more probability if the daily chart shows an uptrend with price pulling back to support.
Intraday vs. Swing Trading Timeframes
Intraday traders typically use 15-minute to 1-hour charts for entries while referencing 4-hour charts for context.
This allows multiple trades per day while staying aligned with the larger trend structure.
Intraday price action requires quick decision-making and tighter stop losses, but offers faster feedback on your trading ideas.
Swing traders operate on 4-hour and daily charts, holding positions for several days to weeks.
This approach requires more patience but typically involves less screen time and lower stress.
Daily price action patterns tend to be more reliable because they incorporate more trading activity and filter out much of the noise present in lower timeframes.
Market Session Considerations
Just because the forex market is 24/5 doesn’t mean you can trade any time. For price action to work effectively, there has to be momentum and volume.
The best price action setups occur during the major market sessions when liquidity is highest—London session (3 AM – 12 PM EST) and New York session (8 AM – 5 PM EST).
The overlap between London and New York sessions (8 AM – 12 PM EST) typically produces the most reliable price action because both European and American traders are active, creating maximum liquidity and clearer price movements.
During low-liquidity periods like the Asian session or late New York session, price action can be choppy and less reliable.
Practical Price Action Trading Strategies: From Analysis to Execution
Understanding price action concepts is valuable, but knowing how to combine them into actionable trading strategies is what actually makes you money.
Here are proven approaches that incorporate the core concepts into complete trading systems.
Strategy 1: Support/Resistance Rejection Trades
This strategy combines support or resistance levels with candlestick confirmation.
Wait for price to approach a well-established support or resistance zone, then look for rejection candlestick patterns—pin bars, engulfing candles, or other reversal patterns.
Entry: Enter on the close of the rejection candle or on a break of its high/low.
For example, if a bullish pin bar forms at support, enter when the price breaks above the pin bar’s high, confirming that buyers have control.
Stop Loss: Place your stop just beyond the rejection candle’s extreme. For a bullish setup, place the stop a few pips below the pin bar’s low. This keeps your risk controlled while giving the trade room to develop.
Take Profit: Target the opposite support or resistance level, a supply or demand zone in the direction of your trade, or a measured move based on the risk-to-reward ratio.
Always aim for at least 1:2 risk-reward, preferably 1:3 or better.
Strategy 2: Supply and Demand Zone Trading
This strategy focuses on fresh supply and demand zones—areas where the price was sharply rejected but hasn’t returned yet.
These “untested” zones often produce explosive moves when price finally returns.
Entry: Wait for price to return to the zone and show rejection behavior. Don’t enter blindly into the zone; wait for confirmation through a rejection candle or break of structure.
For a demand zone, you want to see a bullish candle closing well into the zone, indicating buyers are defending it.
Stop Loss: Place stops beyond the zone. If trading a demand zone, your stop goes a few pips below the zone’s low.
The idea is that if price truly breaks through the zone, the setup has failed, and you want to exit quickly.
Take Profit: Target the nearest opposite zone, the next major structure level, or trail your stop as the move progresses.
Supply and demand move often result in strong, directional runs, so don’t be afraid to let profits run while protecting with a trailing stop.
Strategy 3: Imbalance Fill and Rejection
Imbalance zones create a magnetic pull for the price to return and “fill the gap.” This strategy combines imbalance zones with support/resistance or supply/demand for high-probability setups.
Entry: Wait for price to fill (return to) the imbalance zone AND show rejection from a coinciding support, resistance, supply, or demand level.
The combination creates a powerful confluence—two independent reasons supporting the same trade.
Stop Loss: Place the stop just beyond the imbalance zone, typically beyond the wick that created the gap. This keeps risk controlled while acknowledging that true failures often show clear breakage of the zone.
Take Profit: Target structural levels in your trade direction. If trading an imbalance within an uptrend, target the next higher high or resistance zone above.
Use the market structure context to set realistic profit targets.
Strategy 4: Trend Continuation Pullback Trading
Trading with the trend dramatically increases your success rate. This strategy involves waiting for pullbacks in established trends, then entering when price shows signs of resuming the dominant direction.
Entry: In an uptrend, wait for the price to pull back to a higher low (maintaining structure) and form a bullish rejection candle at support, a demand zone, or an imbalance.
Enter on the break of that rejection candle’s high.
Stop Loss: Place below the pullback low, giving enough room for natural price movement but tight enough to maintain good risk-reward.
In strong trends, pullbacks are often shallow, allowing for tighter stops.
Take Profit: Target the previous high in an uptrend (or previous low in a downtrend) as a conservative target.
For more aggressive profits, target extension levels or trail your stop as the trend continues, potentially catching extended moves.
Common Price Action Trading Mistakes and How to Avoid Them
Even traders who understand price action concepts often struggle with consistent profitability. Here are the most common mistakes that sabotage price action traders and how to overcome them.
Mistake 1: Trading Every Setup Without Context
Many traders see a pin bar and immediately take the trade without checking whether it aligns with the higher timeframe structure, occurs at a significant level, or has proper confluence.
Not all pin bars are created equal—a pin bar in the middle of nowhere has far less significance than one at a major supply zone during a downtrend.
Solution: Always require Confluence. The best trades have multiple factors aligning: trend direction, structural level, candlestick pattern, and ideally an imbalance or supply/demand zone.
The more factors confirming your bias, the higher your probability of success.
Mistake 2: Emotional Trading After Losses
Price action trading takes time to master and can be subjective based on traders’ experiences.
After a losing trade, emotional traders often abandon their plan, take revenge trades, or second-guess valid setups.
The emotional noise drowns out the clear price action signals.
Solution: Accept that losses are part of trading. Professional traders expect to lose 40-50% of their trades and remain profitable through proper risk management.
After a loss, step away from the charts for at least an hour, review the trade objectively to ensure you followed your plan, then return with a clear mindset.
Mistake 3: Moving Stops to Avoid Losses
When a trade moves against you, the temptation to move your stop “just a little further” to avoid taking the loss is enormous. This single habit destroys more trading accounts than perhaps any other mistake.
Solution: Set your stop when you enter the trade based on logical price structure (beyond the rejection point, beyond the zone, beyond the structural level). Once set, never move it wider.
If price hits your stop, the setup failed—accept it and move on. Your stop placement should be part of your pre-trade plan, not an emotional reaction.
Mistake 4: Ignoring Risk Management
Traders often focus so intensely on finding perfect entries that they neglect position sizing and risk management. You can have a 70%-win rate and still lose money with poor risk management.
Solution: Never risk more than 1-2% of your account on any single trade. Calculate your position size based on the distance from entry to stop loss.
If a setup requires a 50-pip stop but your account only allows risking 30 pips for proper position sizing, skip the trade or find a better entry with a tighter stop.
Mistake 5: Chasing Price After Missing the Entry
You identify a perfect setup, but hesitate. Price takes off without you. Now you’re watching profits you “should have” made, and you impulsively jump in late—often right before a pullback or reversal.
Solution: If you miss an entry, let it go. There will always be another setup tomorrow, next week, next month.
The market provides endless opportunities. Chasing price is how you enter at the worst possible time with poor risk-reward. Wait patiently for the next proper setup.
Mistake 6: Over-Analyzing and Paralysis by Analysis
Price action offers so many factors to consider that some traders freeze, unable to pull the trigger even on perfect setups.
They find reasons to doubt every trade, searching for absolute certainty that doesn’t exist in trading.
Solution: Create clear, written criteria for your setups. When a setup meets your criteria, take it without overthinking.
Trading is about probability, not certainty. You won’t know if any individual trade will work until after the fact, but following a proven approach consistently will lead to profitability over many trades.
Real Trading Scenarios: Seeing Price Action in Action
Theory becomes powerful when you see how it applies in actual market situations. Let’s walk through realistic scenarios that demonstrate price action principles in real trading contexts.
Scenario 1: EUR/USD Support Zone Rejection
Imagine EUR/USD has been in a daily uptrend, making higher highs and higher lows.
Price pulls back to a support zone at 1.0850, which previously acted as resistance before being broken (old resistance becoming new support).
This support level also coincides with a demand zone created two weeks ago when price shot up rapidly from this area.
As price approaches 1.0850, you watch for confirmation. On the 4-hour chart, a bullish pin bar forms—price wicked down to 1.0840 but rejected strongly, closing at 1.0865.
This pin bar shows sellers tried to push lower, but buyers overwhelmed them.
You enter at 1.0870 (just above the pin bar high), with a stop at 1.0835 (below the pin bar low and the support zone), risking 35 pips.
Your target is the previous high at 1.0950, giving you 80 pips of potential profit—better than 2:1 risk-reward.
This trade has everything: trend alignment (uptrend), structural level (support), candlestick confirmation (pin bar), zone confluence (demand and support overlap), and proper risk-reward.
This is what high-probability price action trading looks like.
Scenario 2: GBP/JPY False Break and Reversal
GBP/JPY has been consolidating between 191.50 resistance and 189.00 support for the past week.
You notice the consolidation is forming at a significant level—the 191.50 resistance is a previous monthly high, making it a strong supply zone.
Price breaks above 191.50, and many traders jump in long, expecting a breakout.
However, after pushing to 191.85, price forms a bearish engulfing candle on the 1-hour chart—a large red candle that completely engulfs the previous green candle. Price closes back below 191.50.
This is a classic false break (or “stop hunt”), where smart money pushed price through a level to trigger stops and trap breakout traders, then reversed.
You enter short at 191.40 (on the break below the engulfing candle low), with stops at 192.00 (above the false break high), risking 60 pips.
Your target is the range bottom at 189.00, offering 240 pips—4:1 risk-reward.
The trade works because you recognized that the breakout lacked strength (immediate rejection), identified the trap through the engulfing pattern, and positioned yourself on the right side of the reversal.
Scenario 3: USD/CAD Imbalance Fill in Downtrend
USD/CAD has been in a strong daily downtrend, making consistent lower lows and lower highs.
During last week’s sharp decline, the price dropped from 1.3650 to 1.3500 in a single day, leaving an obvious imbalance zone between 1.3600-1.3625 (the gap between candle wicks).
The downtrend continues over the next week, but then price starts pulling back.
You watch as price climbs from 1.3450 back toward 1.3600. You’re looking for an opportunity to join the trend, and the imbalance zone offers perfect positioning.
As price enters the imbalance zone at 1.3605, you watch the 4-hour chart. Price fills the imbalance and immediately forms a bearish pin bar, rejecting strongly from 1.3630 and closing at 1.3595.
This shows the zone is acting as supply—sellers are defending this area.
You enter short at 1.3590 (on break of the pin bar low), with stops at 1.3640 (above the pin bar high and the imbalance zone), risking 50 pips.
Your target is the recent low at 1.3450, offering 140 pips potential profit—nearly 3:1 risk-reward.
This trade succeeds because you combined trend direction (downtrend), imbalance zone (natural resistance), candlestick confirmation (bearish pin bar), and proper timing (waiting for price to fill the gap before entering).
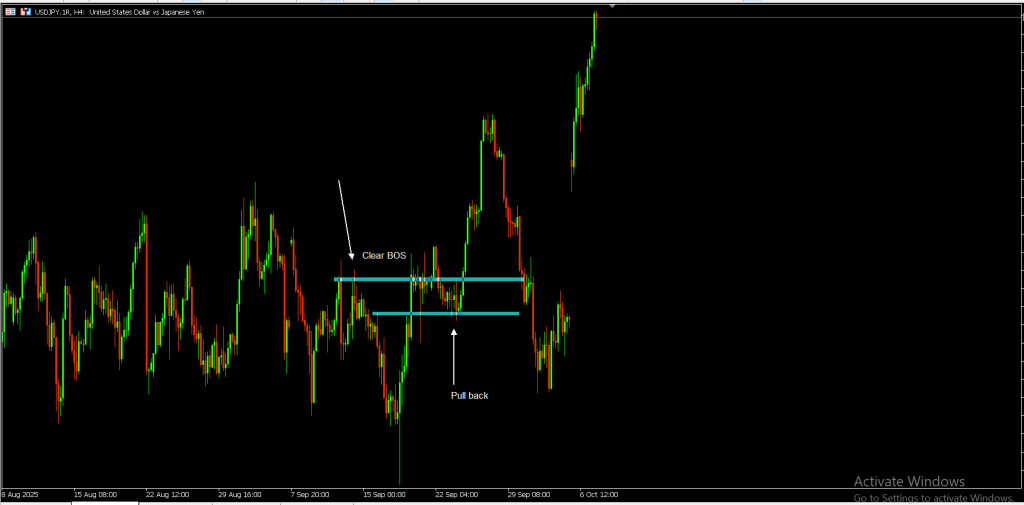
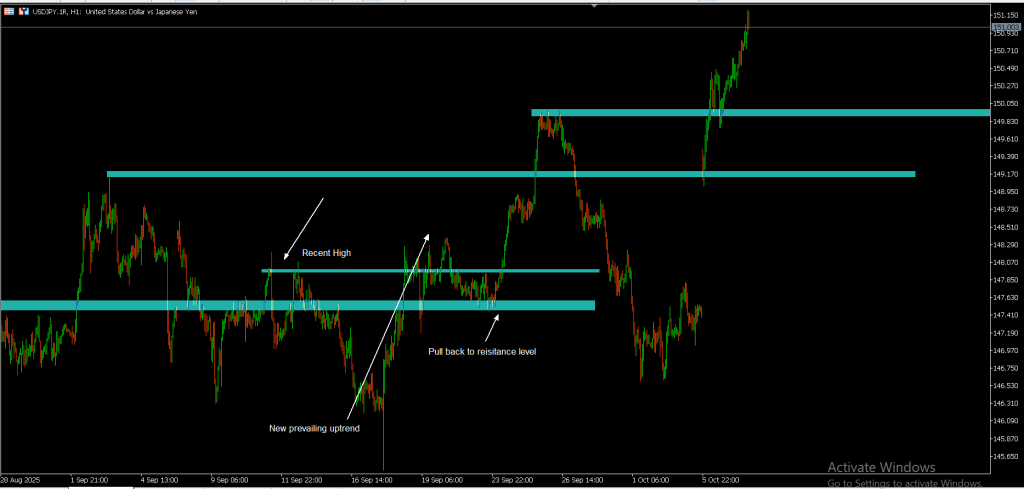
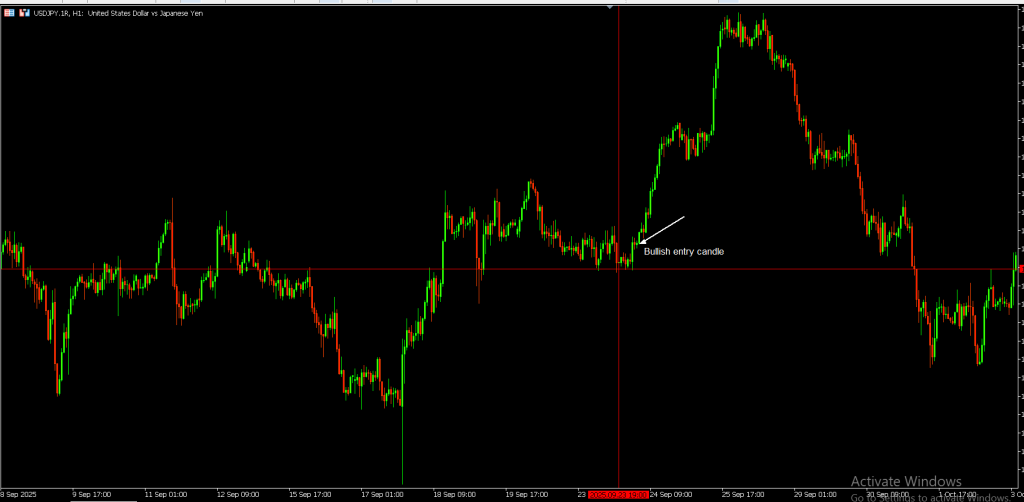
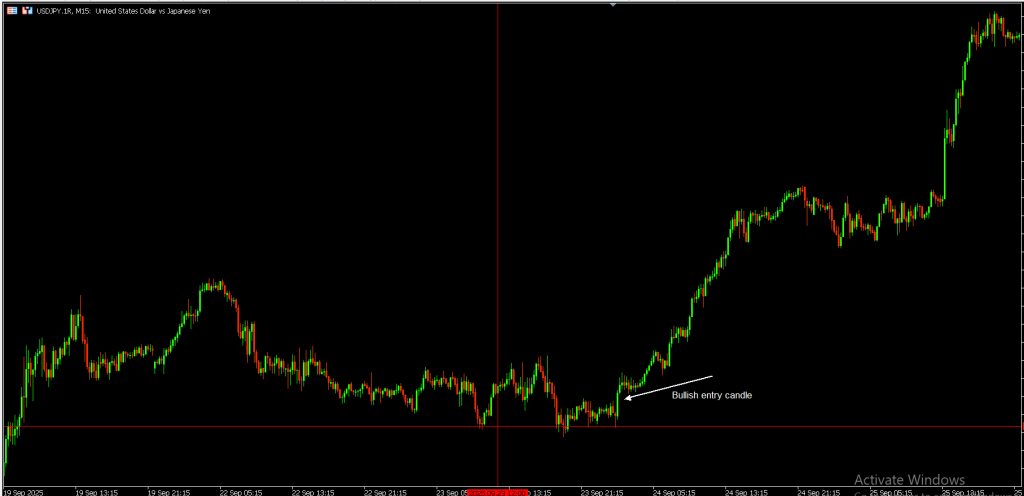
Price Action Strategy Examples with Live Chart Images
Building Your Price Action Trading Plan: From Knowledge to Consistent Execution
Understanding price action concepts is just the beginning. Consistent profitability requires a structured plan that transforms knowledge into systematic execution.
Step 1: Define Your Trading Approach
Choose whether you’ll be a day trader, swing trader, or position trader. This determines your timeframes and how much time you’ll spend monitoring charts.
Day traders need to watch charts throughout the session; swing traders can check charts a few times daily; position traders might only analyze charts once per day.
Write down your primary timeframe for entries and your higher timeframes for context. For example: “I enter trades on the 1-hour chart after analyzing 4-hour and daily charts for context and structure.”
Step 2: Create Your Setup Checklist
Write a specific checklist for the setups you’ll trade. Be precise. For example:
- Price must be in a clear uptrend on the daily chart (higher highs and higher lows)
- Price pulls back to a support level, demand zone, or imbalance
- A bullish rejection candle forms (pin bar or engulfing)
- The setup offers at least 1:2 risk-reward
- Entry occurs on break of the rejection candle high
Having this checklist prevents emotional decision-making. When you spot a potential setup, run through your checklist. If everything checks, take the trade. If not, pass.
Step 3: Establish Risk Parameters
Decide how much you’ll risk per trade (typically 1-2% of your account) and your maximum daily loss limit (usually 3-4% of your account).
These rules protect your capital during inevitable losing streaks.
Calculate your position size based on the distance from entry to stop, not on how many lots you want to trade.
If your stop needs to be 50 pips away but you’re only willing to risk $100, you calculate position size as: $100 / 50 pips = $2 per pip = 0.2 standard lots.
Step 4: Document Your Trades
Keep a trading journal with screenshots of every trade. Record your entry reasoning, the timeframe context, where you placed stops and targets, and the outcome.
Most importantly, note your emotional state and any deviations from your plan.
Review your journal weekly. Look for patterns—are you more successful with certain setups? Do you struggle with specific mistakes?
Are losses due to bad setups or poor execution of good setups? This reflection accelerates your improvement.
Step 5: Practice on Demo Before Going Live
If you’re new to price action, spend at least 2-3 months trading demo accounts with your complete plan.
Track your statistics: win rate, average risk-reward, profit factor, maximum drawdown. Only move to a live account when you’ve demonstrated consistent profitability over at least 50 trades.
When you do start live trading, begin with small position sizes (0.01 lots or micro lots).
The psychological difference between demo and live is significant. Starting small lets you adjust to trading real money without risking meaningful capital.
Advanced Price Action Concepts: Taking Your Trading to the Next Level
Once you’ve mastered the fundamentals, these advanced concepts will refine your edge and improve your decision-making.
Reading Accumulation and Distribution Patterns
Before major moves, smart money (banks, hedge funds, institutional traders) accumulates or distributes positions.
These phases appear as consolidation patterns where price moves sideways, often frustrating retail traders who entered expecting immediate movement.
During accumulation (before upward moves), price consolidates near support with occasional false breaks to the downside that quickly reverse.
During distribution (before downward moves), price consolidates near resistance with occasional false breaks upward that fail.
Learning to recognize whether consolidation is accumulation or distribution helps you position yourself with smart money rather than against it.
Look for which side (support or resistance) gets defended more aggressively through sharp rejections.
Order Flow and Market Depth Reading
While pure price action doesn’t require looking at volume, understanding order flow concepts enhances your analysis.
When price approaches a level and suddenly accelerates through it, this suggests strong order flow in that direction.
When price approaches a level and slows, consolidates, or reverses, this suggests opposing orders are absorbing the move.
This concept helps you distinguish between true breakouts (accelerating price with strong follow-through) and false breaks (price penetrates a level but immediately loses momentum and reverses).
Multiple Timeframe Confluence
The most powerful setups align across multiple timeframes.
For example, a bullish pin bar on the 1-hour chart gains significance when the 4-hour chart shows price at support within an uptrend, and the daily chart shows a higher low formation.
Develop a systematic approach to checking 3-4 timeframes for every trade.
The more timeframes confirming your bias, the higher your conviction and the more aggressively you can position (within your risk parameters).
Psychological Market Levels
Beyond technical support and resistance, certain price levels carry psychological significance—round numbers (1.0000, 1.5000), previous week/month/year highs and lows, and levels where major news occurred.
These levels often attract extra attention from traders, creating self-fulfilling support or resistance.
Incorporate these psychological levels into your analysis. When a technical level aligns with a psychological level, it gains extra significance and often produces stronger reactions.
Conclusion: Your Path to Price Action Mastery
Price action trading offers a timeless approach to reading markets that has served traders for decades before modern indicators existed and will continue to work as long as human psychology drives markets.
By focusing on the raw price movement, support and resistance levels, supply and demand zones, candlestick patterns, imbalance areas, and market structure, you gain direct insight into the battle between buyers and sellers.
Remember that mastering price action is a journey, not a destination. The concepts are straightforward, but applying them consistently requires practice, discipline, and emotional control.
Start by studying charts daily, marking key levels, and paper trading your setups until pattern recognition becomes second nature.
Your immediate action steps are clear:
- Choose 2-3 currency pairs to focus on initially (EUR/USD, GBP/JPY, and USD/JPY are excellent starting points due to their liquidity)
- Set up your charts with clean, naked price action—no indicators except perhaps key support and resistance levels
- Begin marking supply and demand zones, imbalance areas, and major structural levels on your charts
- Create your setup checklist based on the strategies outlined in this article
- Start a trading journal and commit to documenting every setup you take
Most importantly, be patient with yourself. Price action takes time to master and can be subjective based on traders’ experiences.
What you see on the charts will become clearer as you gain experience. The key is consistent practice with a structured approach, proper risk management, and honest self-reflection.
The market will always be there, providing endless opportunities.
Your job isn’t to catch every move—it’s to patiently wait for the high-probability setups that meet your criteria, execute them with discipline, and protect your capital when you’re wrong.
For additional educational resources from authoritative sources, visit Priceaction.com for extensive guides, video tutorials, and ongoing market analysis from experienced price action traders.
Start today with small position sizes, focus on quality over quantity, and let the price action guide your decisions.
Post a Reply
You must be logged in to post a comment.