
 English
 German
  Italian
  Hi, User
 Crash 500 Index: Your Complete Guide to Trading This Volatile Synthetic Market
Ever watched your screen for hours waiting for that perfect spike, only to miss it by seconds? Or worsejumped into what looked like a massive crash opportunity, only to see the market reverse and stop you out instantly? If you’ve traded Crash 500, you know exactly what I’m talking about. This synthetic index can feel like a psychological roller coaster, promising massive profits one moment and delivering painful losses the next.
Here’s the truth: Crash 500 isn’t hard to trade once you understand its unique behavior pattern. Unlike traditional forex pairs that respond to economic news and market sentiment, Crash 500 follows a mathematically predictable structure that many traders completely overlook. In this guide, I’m going to break down everything you need to know about trading Crash 500, from understanding its spike mechanics to developing strategies that actually work. By the end, you’ll have a clear roadmap for approaching this volatile instrument with confidence instead of confusion.
What Is Crash 500 Index?
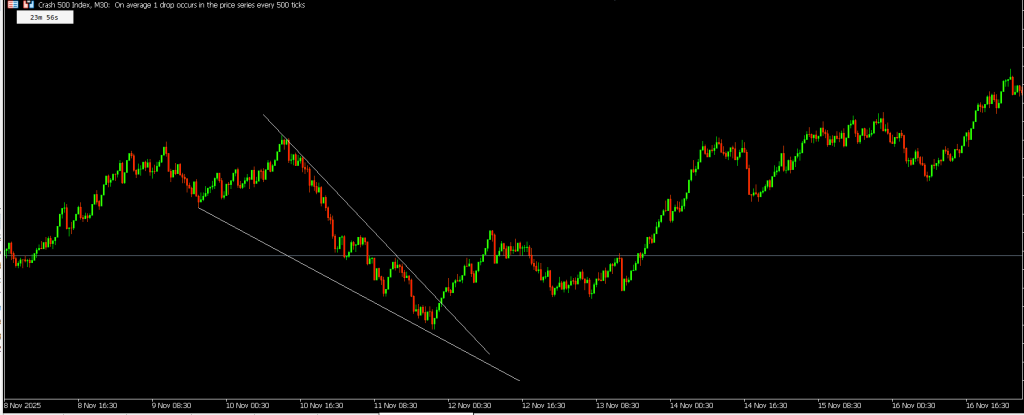
Crash 500 is a synthetic index offered by Deriv that simulates a market with frequent downward spikes. Unlike real-world markets affected by news events, economic data, or trader sentiment, Crash 500 is generated by a cryptographically secure random number generator. This means its behavior follows a specific mathematical pattern: on average, one significant price drop occurs every 500 ticks.
Think of ticks as individual price movements. With Crash 500, every 500 ticks (on average) produces a dramatic downward spike before the price immediately recovers to continue its upward trajectory. The “average” part is crucial here. You won’t see a crash exactly every 500 ticks like clockwork. Sometimes crashes happen after 200 ticks, sometimes after 800. This randomness within a predictable framework is what makes Crash 500 both challenging and opportunity-rich for price action traders.
How Crash 500 Differs from Traditional Markets
While forex pairs like EUR/USD or GBP/JPY move based on interest rates, geopolitical events, and market liquidity, Deriv synthetic indices operate in their own mathematical universe. Crash 500 trades 24/7, including weekends and holidays, giving you access when traditional markets are closed. There’s no waiting for London open or New York session volatility.
This synthetic nature eliminates real-world market risks. You won’t see Crash 500 gap because of an unexpected central bank announcement or a geopolitical crisis. The crashes happen randomly but within the defined statistical probability, making the market behavior more consistent over time.

Understanding the Crash Mechanics: Why Prices Spike Downward
The defining characteristic of Crash 500 is its periodic downward spikes. The price generally trends upward in small increments, tick by tick, building higher and higher. Then suddenly, without warning, it plummets dramatically before instantly recovering to continue its upward climb.
These crashes aren’t triggered by anything you can predict through fundamental analysis or news trading. They’re built into the algorithm. The random number generator determines when each crash occurs, ensuring that over thousands of ticks, the average works out to one crash per 500 ticks.
Here’s what a typical Crash 500 pattern looks like: The market climbs steadily… climbs… climbs… then BOOM, a violent drop that can span hundreds of index points in a single candle. Within seconds, the price rebounds and resumes its upward journey as if nothing happened.
The Psychology Behind Crash 500 Trading
Understanding this mechanical behavior is critical because it shapes your entire trading approach. Many traders fail with Crash 500 because they try to apply traditional support and resistance thinking or attempt to predict when crashes will happen. They see the uptrend and think “this has to crash soon” after 400 ticks, then watch it climb another 600 ticks before finally spiking down after their patience has expired.

The key psychological shift you need: Stop trying to predict individual crashes and start trading the probability pattern. You’re not trading news or sentiment. You’re trading a mathematical simulation with built-in volatility spikes.
Practical Trading Strategies for Crash 500
Let’s get into actionable strategies you can implement immediately. Trading Crash 500 effectively requires understanding whether you’re trying to catch the crash itself or trade the recovery phase.
Strategy 1: Trading the Spike (Crash Entry)
This approach involves entering trades when you anticipate an imminent crash. The challenge? You can’t know exactly when it’ll happen. However, you can use tick counting and volatility observation to improve your timing.
Entry Technique: Monitor the tick count from the last crash. As you approach 400-500 ticks without a spike, begin watching for entry opportunities. Look for signs of price exhaustion in the uptrend smaller candle bodies, indecision candles, or temporary pauses in the climb. Place a sell order with a tight stop loss above the recent high.
Take Profit Strategy: Crash spikes can drop 500-1,000+ index points in seconds. Set your take profit to capture a significant portion of the drop, perhaps 60-70% of typical crash depths you’ve observed.
Risk Management: Never risk more than 1-2% of your account on a single crash trade. The unpredictability of timing means you might enter multiple times before catching a spike. Use position sizing that allows you to sustain 3-5 attempts if necessary.

Strategy 2: Trading the Recovery (Bounce Back)
Many traders find more consistency trading the recovery rather than the crash itself. After a spike down, Crash 500 almost always bounces back quickly, which presents a high-probability opportunity.
Entry Technique: Wait for a confirmed crash to complete. You’ll see the violent downward spike followed by immediate buying pressure. Enter a buy position as the price begins its recovery, ideally within 5-10 ticks after the spike bottom. Your entry confirmation comes from observing an engulfing candle or series of bullish candles immediately after the crash.
Stop Loss Placement: Place your stop loss 50-100 points below the crash low. If the price breaks below this level, something unusual is happening, and you want to exit.
Take Profit Strategy: Target a return to 50-80% of the pre-crash level. The market usually retraces most of the spike quickly, then continues its upward trend.
Strategy 3: Range Trading Between Crashes
Between crash events, Crash 500 tends to establish temporary ranges or trend channels. You can trade these calmer periods using traditional price action concepts.
Identifying the Range: Look at support and resistance levels that form between crashes. The market climbs but often respects certain psychological levels before breaking higher.
Entry and Exit: Buy near support levels (previous lows between crashes) and sell near resistance (recent highs before anticipated crashes). Use indecision candles at these levels as entry signals. An indecision candle at support, followed by a bullish engulfing candle, gives you a strong buy signal for the continuation upward.
Connecting Crash 500 to Core Price Action Concepts
While Crash 500 operates differently from traditional markets, fundamental price action principles still apply in adapted forms.
Supply and Demand: In Crash 500 index, the sudden drop represents supply; the algorithm dumps synthetic sell orders. The immediate recovery shows overwhelming demand.
Support and Resistance: Between crashes, temporary support and resistance levels do form. These aren’t based on institutional orders but on the mathematical progression of the index.
Imbalance Zones: The crash itself creates an extreme imbalance, huge selling pressure with no buying resistance. The recovery fills this imbalance.
Indecision Candles: Before some crashes, you’ll notice indecision candles as the uptrend pauses. These doji or spinning top formations can signal hesitation in the algorithm’s upward progression.
Engulfing Candles: The recovery phase often produces massive bullish engulfing candles that swallow the crash candle. These are your strongest signals for recovery trades.
Market Structure: Crash 500 maintains an overall bullish structure punctuated by violent corrections. Higher highs and higher lows form between crashes, creating an ascending pattern.
Common Mistakes Traders Make with Crash 500
Mistake 1: Trying to Predict Exact Crash Timing
I’ve seen countless traders blow accounts trying to call the exact tick when a crash will happen. They’ll count to 500 ticks and immediately go all-in on a sell trade, only to watch the market climb another 300 ticks. Remember: 500 ticks is an average, not a schedule.
Mistake 2: Holding Positions Through Crashes
Some traders take buy positions during the uptrend and hold through crashes, expecting to recover. This works sometimes but leads to massive drawdowns that can trigger margin calls. Use stop losses religiously.
Mistake 3: Overleveraging on “Sure Things”
The recovery after a crash feels like free money. The market always bounces back, right? This thinking leads traders to use excessive leverage, and when one recovery is slower or less complete than expected, they face devastating losses. Stick to conservative leverage (1:100 or less) and risk management rules even on high-probability setups.
Mistake 4: Ignoring Tick Volume
Not all 500-tick periods are created equal. Some periods have higher tick velocity (more ticks per minute), while others drag on. Track not just tick count but time elapsed.
Leverage and Risk Management for Crash 500
Deriv offers leverage up to 1:1000 on Crash indices, which sounds incredible but can be devastating if misused. With Crash 500’s volatility, high leverage amplifies both gains and losses exponentially.
Recommended Approach: Start with 1:100 leverage maximum until you’ve demonstrated consistent profitability over 50+ trades. Even experienced traders rarely need more than 1:200 on Crash 500, given the dramatic price movements.
Position sizing matters more than leverage. Calculate your risk per trade in dollar terms (1-2% of account balance) and adjust your lot size to match this risk with your stop loss distance.
The 24/7 nature of Crash 500 creates another risk: overtrading. Because you can always find action, discipline becomes critical. Set daily loss limits (3-5% maximum) and daily profit targets (5-10%). When you hit either, stop trading.
Taking Action: Your Next Steps with Crash 500
You now understand what makes Crash 500 unique, how its crash mechanics work, and multiple strategies for trading it profitably. Knowledge alone won’t make you profitable; practice will.
Start by opening a demo account with Deriv and watching Crash 500 behavior without placing trades. Count ticks between crashes for at least 20 crash cycles. Record the actual tick numbers and notice the variance around the 500-tick average. This observation phase builds your intuition for the market’s rhythm.
Next, practice one strategy at a time. If recovery trading appeals to you, focus exclusively on that for your first 30 trades. Track your results, win rate, and average profit per trade. Only after proving consistency should you add additional strategies to your approach.
Remember: Crash 500’s synthetic nature means past performance is actually a reasonable indicator of future patterns, unlike traditional markets, where this disclaimer always applies. The algorithm doesn’t change unless Deriv modifies it, giving you a stable learning environment.
For more insights on trading Deriv synthetic indices, check out Weltrade pain and gain indices to understand how other synthetic instruments operate. The skills you develop on Crash 500 transfer beautifully to these related markets, expanding your trading opportunities.
The key to mastering Crash 500 isn’t predicting every crash; it’s understanding probability, managing risk religiously, and executing with discipline. Start small, prove your edge, then scale gradually. This volatile synthetic market rewards patience and punishes recklessness. Which side of that equation will you be on?
Post a Reply
You must be logged in to post a comment.