
 English
 German
  Italian
  Hi, User
 How to Draw Supply and Demand Zones on Charts: A Clear Step-by-Step Guide
Ever stared at your chart trying to identify supply and demand zones, only to feel completely confused about where actually to draw them?
You’re not alone. Despite numerous tutorial videos available, most forex traders struggle with the practical application of supply and demand, particularly when it comes to drawing these zones accurately in real-time trading situations.
Here’s the frustrating reality: understanding the theory behind supply and demand is one thing, but knowing exactly where to place those zones on your chart when the market is moving?
That’s a completely different challenge. You might recognize that supply and demand exist, but when it’s time to mark them on your chart, doubt creeps in. “Is this the right zone?” “Should I include this candle or that one?” “Why does my zone keep getting violated?”
This article strips away all the noise and confusion. We’re not going to rehash the entire supply and demand theory—that groundwork has already been covered.
Instead, we’re laser-focused on one specific skill: how to draw supply and demand zones on your chart with confidence and clarity.

By the end of this guide, you’ll know exactly what to look for, where to draw your zones, and how to identify high-probability supply and demand areas that actually hold.
Let’s eliminate the guesswork and get you drawing supply and demand zones like a professional trader.
Understanding What Makes a Valid Supply and Demand Zone
Before we dive into the mechanics of drawing zones, you need to understand what actually creates a valid supply and demand zone in the first place.

This foundational knowledge will prevent you from marking every price level on your chart and cluttering your analysis with zones that have no real significance.
Supply and demand zones are not arbitrary rectangles you randomly place on your chart.
They represent specific areas where institutional traders (the big players with serious capital) have entered the market with such force that they’ve created an imbalance between buyers and sellers.
This imbalance is what causes those sharp, impulsive price movements you see on your charts.
Think of it this way: when a large institution wants to accumulate a position (buy a massive amount of currency), it can’t just place one huge order without moving the market against itself.
Instead, they accumulate gradually at a specific price level, building their position quietly.

Once they’ve accumulated enough, they release their buying pressure all at once, creating a sharp move away from that zone.
This leaves behind what we call a demand zone, a price level where buying interest overwhelmed selling pressure.
The same logic applies to supply zones, except institutions are distributing (selling) rather than accumulating.
They build up sell positions at a level, then release that selling pressure, creating a sharp price drop.
The key insight here is this: valid supply and demand zones are characterized by what happens after the accumulation or distribution phase.
You’re looking for explosive, impulsive moves away from a consolidation area. If the price just drifts slowly away from a level, that’s not a strong supply or demand zone.
You want to see power—engulfing candles, decisive breaks, and rapid price expansion.
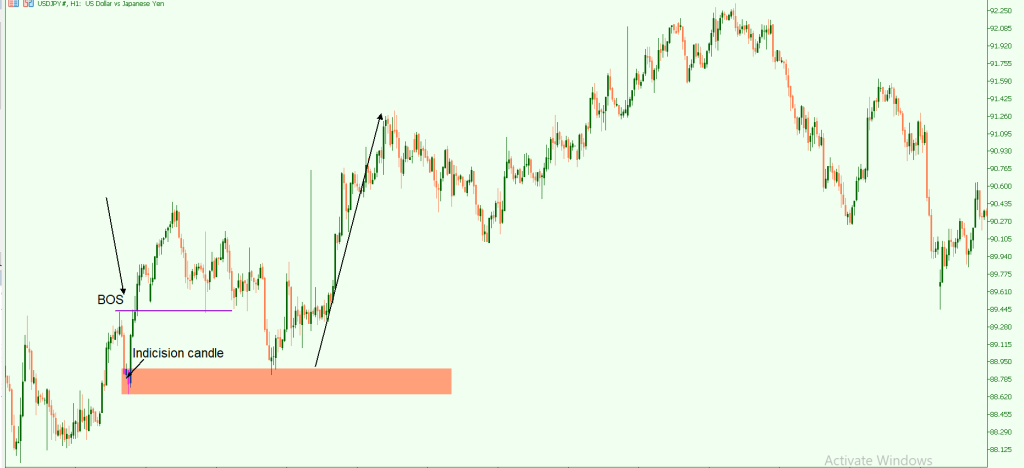
This is why understanding market structure and price action patterns like engulfing candles and indecision candles becomes crucial.
These elements work together to help you identify where institutions have left their footprints on the chart.
An indecision candle often represents the accumulation phase (the calm before the storm), while the engulfing candles that follow represent the explosive move as the institutional order is executed.
Without this context, you might draw zones at every support and resistance level on your chart, wondering why most of them fail.
Valid zones have specific characteristics, and recognizing these characteristics is the first step toward drawing zones that actually matter.
Step 1: Identifying Impulsive Moves That Create Trends
The foundation of drawing supply and demand zones starts with identifying impulsive candle moves that create a new prevailing or dominant trend.
This is your primary signal that something significant has happened at a specific price level. But what exactly does an “impulsive move” look like, and how do you spot it in real-time?
An impulsive move is characterized by strong, decisive candles that show clear directional bias. You’re not looking for small, choppy price action where each candle barely moves; you’re looking for momentum.
These moves typically feature engulfing candles, which are candles that completely engulf the previous candle’s body, signaling that one side of the market (buyers or sellers) has taken complete control.
Here’s what to look for specifically:
The Setup Pattern
Before the explosive move, you’ll often notice a small period of indecision or consolidation.
This might appear as a single indecision candle (like a doji or spinning top) or a few small-bodied candles that show the market is coiling up before the breakout.
This consolidation phase is actually the accumulation or distribution happening—the institutional players building their positions before unleashing the impulsive move.
The Explosive Move
Following this consolidation, you’ll see one or more engulfing candles that break out powerfully in one direction.
These candles should have larger bodies than the preceding consolidation candles, minimal wicks on the breakout side, and strong momentum.
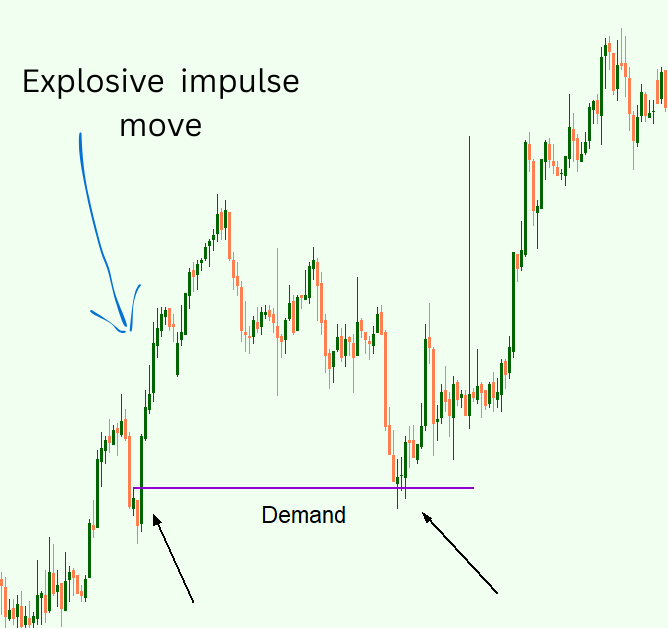
When you see this pattern, it’s telling you that significant orders were executed at that consolidation level.
Time Frame Considerations
There is a discussion among traders on which time frame is the best for supply and Demand. From practical trading experience, these patterns work much better on higher time frames—think 4-hour, daily, or weekly charts.
In these time frames, the impulsive moves carry more weight because they represent larger market participants making significant decisions.
Lower time frames can show impulsive moves too, but they’re often just noise or short-term fluctuations that don’t hold the same institutional significance.
The Exception to the Rule
It’s important to note that not every valid zone will have perfect engulfing candles in the setup. Sometimes you’ll see quick impulse moves without the classic engulfing pattern, just a rapid, decisive break from a level.
What matters most is the character of the move: it needs to be strong, directional, and create a new trend or continue an existing trend with renewed momentum.
When you identify these impulsive moves, you’re essentially finding the footprints of major market players.
They’ve executed large orders at a specific level, and if price returns to that level, there’s a good chance there are still unfilled orders waiting, or these players will defend their positions.
This is why price often respects these zones when tested again.
The critical skill here is training your eye to distinguish between genuine impulsive moves that signal institutional activity and ordinary price fluctuations.
Ask yourself: “Did this move change the character of the market? Did it establish a new trend or reinforce an existing one?” If the answer is yes, you’ve likely found a zone worth marking on your chart.
Step 2: Drawing Zones at Market Highs and Lows
Once you’ve identified an impulsive move, the next crucial step is knowing exactly where to draw your supply and demand zone.
This is where many traders make critical mistakes that undermine their entire analysis. Drawing zones at the wrong location means you’ll be entering trades at suboptimal levels, placing stops in vulnerable positions, and watching helplessly as “good” setups fail.
The Golden Rule
Supply and demand zones are best drawn at the highs and lows of the chart, specifically at the extreme points where the market has made significant turns.
These highs and lows represent inflection points where the balance of power shifted dramatically between buyers and sellers.
For a demand zone (where you expect buying pressure), you’re looking at the low point that preceded an impulsive move upward.
This is the last area where price consolidated or formed that small indecision before the explosive rally.
Your zone should capture the consolidation area, not just a single candle, but the base from which the impulsive move launched.
Typically, this includes the lows of the small indecision candles or consolidation patterns right before the engulfing move upward.
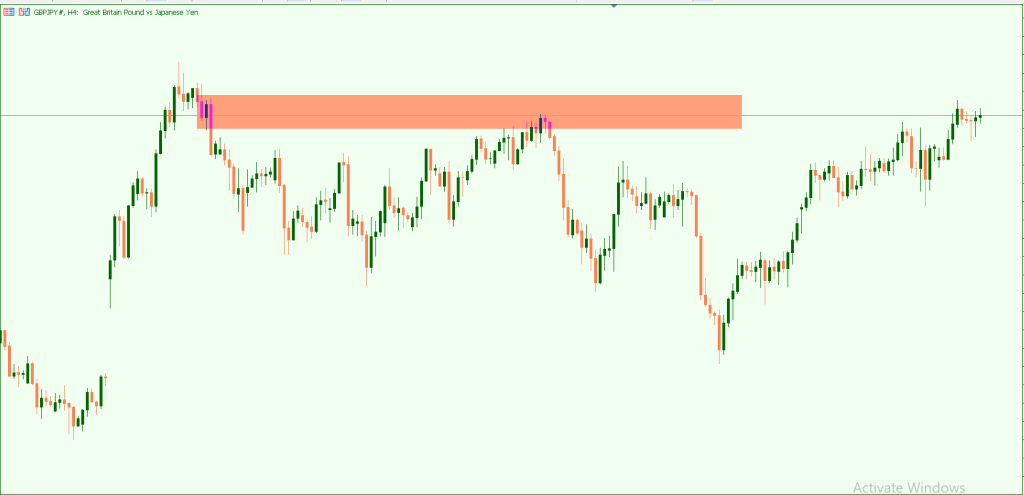
For a supply zone (where you expect selling pressure), you’re looking at the high point that preceded an impulsive move downward.
This is the area where the price consolidated or showed indecision before dropping sharply.
Your zone should encompass the highs of this consolidation area, the level where the market paused before institutional sellers unleashed their orders.
How Wide Should Your Zone Be?
Many traders struggle with whether to draw zones as thin lines or wider rectangles.
Here’s the practical approach: your zone should be wide enough to capture the consolidation or indecision area, but not so wide that it becomes meaningless.
A good rule of thumb is to include the bodies of the indecision candles or small consolidation candles that preceded the impulsive move, including the wicks of these candles.
Think of your zone as a “region of interest” rather than an exact price line. Markets don’t turn on precise prices; they turn within price ranges.
Your zone represents the range where institutional orders were likely placed.
When price returns to this zone, it’s entering the area where those big players might have unfilled orders or will defend their positions.
The Proximity Rule
This is crucial and often overlooked. The best supply and demand zones appear near accumulation areas—meaning they’re positioned near significant market structure points like swing highs and swing lows. These are the zones that have context within the larger market picture.
Avoid zones that form in the middle of ranging markets or within tight consolidations where price is just grinding sideways.
These zones lack context and are easily “run through” by price because they don’t represent significant institutional decision points.
They’re just areas where price happened to pause momentarily, without any major player taking a substantial position.
When you find zones near the extremes at major swing points where the market was making important decisions, you’re identifying areas with true significance.
These zones are where the market structure was being created or defended. When price returns to test these levels, there’s institutional memory and interest at those prices.
Practical Drawing Technique
Start by identifying the impulsive move. Then trace backward to find the consolidation or indecision area immediately before that impulsive move.
Draw a rectangle that encompasses this base area, from the highest point of the consolidation (for supply) or the lowest point (for demand) to where the impulsive candle originated.
This zone captures the entire area where institutional accumulation or distribution likely occurred.
Recognizing Context: Why Location Matters More Than the Pattern
You could identify perfect impulsive moves with textbook engulfing candles and still fail miserably if you’re drawing zones without considering context.
This is perhaps the most critical distinction between traders who consistently profit from supply and demand versus those who constantly get caught in false setups.
Understanding Market Context
Every supply and demand zone doesn’t carry equal weight. A zone’s probability of holding depends heavily on where it appears within the overall market structure.
This is why you need to look at the bigger picture before marking zones on your chart.
High-Quality Zones
The zones you want to trade are those that form near significant market structure points—major swing highs and lows where the market has made important directional decisions.
These areas represent places where the market’s trend or direction was established or defended.
When price returns to these levels, you’re revisiting a battleground where major players previously took strong positions.
Think about it logically: if a zone formed at a major low before a strong rally that established an uptrend, that zone represents where buyers took control and changed the market’s direction.
If price pulls back to that zone again, those same buyers (or similar institutional players) are likely to defend that level because it’s a significant structural support for the trend they initiated.
Low-Quality Zones to Avoid
Zones that form within ranging markets or tight consolidation areas are problematic for several reasons.
First, they lack directional context—the market wasn’t making any significant directional decision when these zones formed.
Second, price in ranging conditions tends to chop back and forth through levels repeatedly, meaning your zone has already been tested multiple times without establishing any real significance.
When you draw supply and demand zones in the middle of ranges, you’re essentially marking every small pause in a sideways market.
These zones are “easily run through” by price because there’s no strong institutional interest defending them. They’re just temporary pauses in a non-directional environment.
The Accumulation Zone Concept
The phrase “good supply and demand zones are best drawn near accumulation zones” refers to areas where the market has accumulated or distributed positions near significant price levels.
Accumulation zones aren’t random spots on the chart—they occur at strategic locations where smart money builds positions before making a directional move.
These strategic locations are typically found:
- At the start of new trends (after breaking out of consolidation)
- At major retracements within established trends (where trends are defended)
- At key market structure breaks (where old resistance becomes new support, or vice versa)
- At extreme price points where the market has historically reversed
Reading the Market Story
Before drawing a zone, ask yourself: “What was the market doing here? Was this a significant turning point, or just a minor pause in sideways movement?”
If the zone appears at a place where the market’s character changed—where a downtrend became an uptrend, or where a retracement ended and the main trend resumed—that’s a zone with context.
Zones without context are like trying to trade without understanding the story the market is telling. You might see the pattern, but you’re missing the meaning behind it.
This is why experienced traders often ignore zones that beginners obsess over. They can see that while the pattern might look valid, the location and context make it low probability.
Practical Context Checklist: Before marking a supply or demand zone, verify:
- Is this zone near a significant swing high or low?
- Did this zone precede a move that established or continued a trend?
- Has this area only been tested once or twice (not ground through repeatedly)?
- Does this zone align with the current market structure?
- Was there a clear shift in market character after price left this zone?
If you can’t answer yes to most of these questions, you’re probably drawing a zone that lacks the context needed for high-probability trading.
Common Mistakes When Drawing Supply and Demand Zones
Even when you understand the theory behind supply and demand zones, practical application often reveals mistakes that undermine your trading results.
Let’s address the most common errors traders make and how to avoid them.
Mistake #1: Drawing Too Many Zones
The most prevalent mistake is cluttering your chart with supply and demand zones everywhere.
When every minor pause in price becomes a zone, you’ve defeated the entire purpose of this analysis.
Your chart looks like a zebra pattern of rectangles, and you’re left confused about which zones actually matter.
The fix: Be selective. Only mark zones that meet all the criteria: impulsive moves near significant market structure points.
Your chart should have relatively few zones—typically 3-5 zones of real significance on any given time frame. If you have more than seven zones marked on a single chart, you’re probably overdoing it.
Mistake #2: Ignoring Time Frame Context
Drawing supply and demand zones on 5-minute or 15-minute charts often leads to disappointment.
These lower time frames are filled with noise—minor fluctuations that don’t represent genuine institutional activity.
The zones might look technically perfect, but they lack the weight of higher time frame decisions.
The fix: Focus on 4-hour, daily, and weekly charts for your primary supply and demand zones. These time frames capture the movements of larger market participants whose positions actually move markets.
You can use lower time frames for entry timing within these larger zones, but don’t rely on low-time-frame zones as your primary trading areas.
Mistake #3: Drawing Zones After Every Engulfing Candle
Just because you see an engulfing candle doesn’t mean you’ve found a valid supply or demand zone.
Many engulfing candles occur within normal price action and don’t represent institutional accumulation or distribution. They might just be short-term momentum shifts or reactions to news events.
The fix: Look for engulfing candles that occur at significant locations and are followed by sustained directional movement.
A single engulfing candle in the middle of a ranging market doesn’t create a valid zone.
You need the engulfing candle plus the context of market structure, plus the resulting impulsive move that creates or continues a trend.
Mistake #4: Making Zones Too Narrow or Too Wide
Some traders draw razor-thin lines for their zones, expecting price to react at an exact price point.
Others draw massive rectangles that span hundreds of pips, making the zone so wide it becomes meaningless. Both extremes create problems.
The fix: Your zone should capture the consolidation area (including wicks) where accumulation or distribution occurred, but remain focused enough to be actionable.
Generally, on a 4-hour chart, a demand or supply zone might span 20-50 pips depending on the currency pair’s volatility.
It should be wide enough to account for price noise but narrow enough to define clear entry and stop-loss levels.
Mistake #5: Forgetting That Zones Have Limited Lifespan
Traders often mark zones and expect them to remain valid forever. In reality, supply and demand zones can be consumed.
When price returns to a zone and moves through it with fresh impulsive momentum, that zone has likely been exhausted—the institutional orders that created it have been filled or are no longer relevant.
The fix: Understand that zones work best on their first or second test. If price has tested a zone three or four times, it’s becoming less reliable.
Each test consumes some of the available liquidity at that level. Once a zone is clearly broken with an impulsive move in the opposite direction, remove it from your chart—it’s no longer valid.
Mistake #6: Drawing Zones in Isolation Without Market Structure
Perhaps the most subtle but damaging mistake is drawing zones purely based on the visual pattern without considering where that pattern appears within the overall market structure.
A perfect-looking zone in the wrong location is still a bad trade setup.
The fix: Always analyze market structure first. Identify the trend, major swing points, and current phase of the market (trending, consolidating, reversing).
Then look for supply and demand zones that align with this structure analysis. A demand zone in a downtrend at a minor swing low is far less significant than a demand zone at a major market structure low that initiated an uptrend.
Mistake #7: Confusing Support/Resistance with Supply/Demand
Many traders treat supply and demand zones as just another name for support and resistance, but there’s a critical difference.
Support and resistance are price levels tested multiple times, while true supply and demand zones are fresh areas where price has only paused once before making an impulsive move.
The fix: Recognize that supply and demand zones are most powerful when they’re untested or lightly tested.
If a level has been hit many times, it’s support or resistance (which can still be useful), but it’s not a fresh supply or demand zone with unfilled institutional orders waiting.
Fresh zones where price “touched once and exploded away” are your highest probability setups.
Putting It All Together: Your Supply and Demand Zone Drawing Checklist
Now that we’ve covered the principles, mistakes to avoid, and key concepts, let’s consolidate everything into a practical, step-by-step process you can follow every time you analyze a chart.
This systematic approach will eliminate guesswork and ensure you’re consistently identifying high-quality zones.
Step-by-Step Drawing Process
1. Analyze Market Structure First. Before you even think about drawing zones, zoom out and understand the bigger picture. Identify:
- Current trend direction (uptrend, downtrend, or sideways)
- Major swing highs and swing lows
- Key structural points where the market made significant directional decisions
This context is your foundation. Everything else builds upon it.
2. Switch to a Higher Time Frame
If you normally trade on the 1-hour chart, analyze the 4-hour or daily chart first. If you trade the 4-hour, look at the daily or weekly.
Higher time frames provide the most reliable supply and demand zones because they capture institutional activity rather than retail noise.
3. Scan for Impulsive Moves
Look for areas where price made decisive, powerful moves away from a consolidation or pause. You’re searching for:
- Strong engulfing candles that show clear directional control
- Rapid price expansion that creates new highs or lows
- Small indecision or consolidation immediately before the explosive move
Mark these impulsive moves on your chart with arrows or highlights—don’t draw the zones yet.
4. Identify the Origin of Each Impulsive Move
For each impulsive move you identified, trace back to find the exact area where price consolidated before the explosion. This is your zone candidate. Look for:
- For demand zones: The low point and small consolidation before an upward explosion
- For supply zones: The high point and small consolidation before a downward explosion
5. Verify Context and Location
Before drawing the zone, ask these qualifying questions:
- Is this zone near a significant swing high or swing low?
- Did price only test this area once or twice (not repeatedly grind through it)?
- Does this zone align with the current market structure?
- Was there a clear directional change or trend continuation after price left this zone?
If you can’t answer “yes” to these questions, skip this zone; it lacks the context needed for high probability.
6. Draw the Zone
Once verified, draw a rectangle that captures:
- The full range of the consolidation/indecision area
- Including the wicks of the candles in that consolidation
- Wide enough to be practical but focused enough to be actionable
Label it clearly (SD for supply, DD for demand) and note the time frame.
7. Limit Yourself
Resist the urge to mark every potential zone. Your chart should have 3-5 significant zones maximum.
If you find yourself drawing more, you’re probably lowering your standards. Remember: quality over quantity.
8. Plan Your Trade Approach
For each zone you’ve drawn, immediately plan:
- Your entry strategy (will you enter at first touch, or wait for confirmation?)
- Stop loss placement (typically just beyond the zone boundaries)
- Target areas (look for the next opposite supply/demand zone or major structure point)
Don’t just draw zones for the sake of having them on your chart; draw them with trading intention.
Quick Reference Checklist
- ✓ Analyzed on a higher time frame (4H+)
- ✓ Identified impulsive move with engulfing candles or strong momentum
- ✓ Found small consolidation/indecision before the impulsive move
- ✓ Zone is at a swing high/low, not in the middle of the range
- ✓ Zone has a clear context within the market structure
- ✓ Zone has only been tested 0-2 times previously
- ✓ Zone width captures the consolidation area reasonably well
- ✓ Entry, stop, and target planned for this zone
Reality Check
When you first apply this process, it might feel slow and methodical. That’s exactly how it should feel.
You’re training your eye to see what matters rather than reacting to every price movement. Over time, this process becomes intuitive, and you’ll spot quality zones within seconds.
But building that intuition requires disciplined practice using this systematic approach.
The goal isn’t to find a zone on every chart you look at. Some charts won’t have any quality zones worth trading—and that’s perfectly fine.
Successful trading is as much about what you don’t trade as what you do. By following this rigorous process, you’ll naturally filter out low-probability setups and focus your capital on the zones that actually matter.
Conclusion: From Confusion to Clarity in Your Zone Drawing
Drawing supply and demand zones doesn’t have to be the frustrating, doubt-filled process it is for most traders.
The confusion comes from trying to apply patterns without understanding context, or from cluttering charts with zones at every minor price pause.
But now you have a clear, systematic approach that cuts through that confusion.
Remember the two fundamental rules we’ve hammered home: First, look for impulsive moves with engulfing candles and small indecision patterns; these signal institutional activity.
Second, draw zones at significant highs and lows near accumulation areas, not within ranging markets where price has no directional context.
Your immediate action steps
- Review your current charts and remove any zones that don’t meet the criteria in this guide
- Re-analyze using the higher time frame approach (4-hour, daily, weekly)
- Practice identifying impulsive moves before you draw any zones
- Verify each zone has proper context within market structure before committing it to your chart
- Limit yourself to 3-5 zones maximum per chart to maintain focus on quality
The difference between struggling with supply and demand versus mastering it comes down to discipline in your approach.
Stop drawing zones everywhere. Stop hoping every small engulfing candle is your next trade.
Instead, be patient and selective, waiting for those high-probability zones that tick all the boxes: impulsive move, proper context, and significant market structure location.
As you practice this systematic approach, you’ll develop an intuitive feel for quality zones. What initially requires careful analysis will eventually become second nature.
Your charts will become cleaner, your trade selection more confident, and your results more consistent.
Supply and demand zone drawing is a skill that improves with deliberate practice. Each chart you analyze correctly strengthens your pattern recognition.
Permit yourself to be selective. Remember, not every chart needs zones marked, and not every zone needs to be traded.
The best traders aren’t those who find the most setups; they’re those who identify the highest quality opportunities and have the discipline to wait for them.
For a deeper understanding of the theory behind supply and demand in forex trading, and how these concepts fit into your overall price action strategy.
Now go clean up your charts, apply this systematic process, and start drawing zones with the confidence and clarity of a professional trader.
Post a Reply
You must be logged in to post a comment.